Answered step by step
Verified Expert Solution
Question
1 Approved Answer
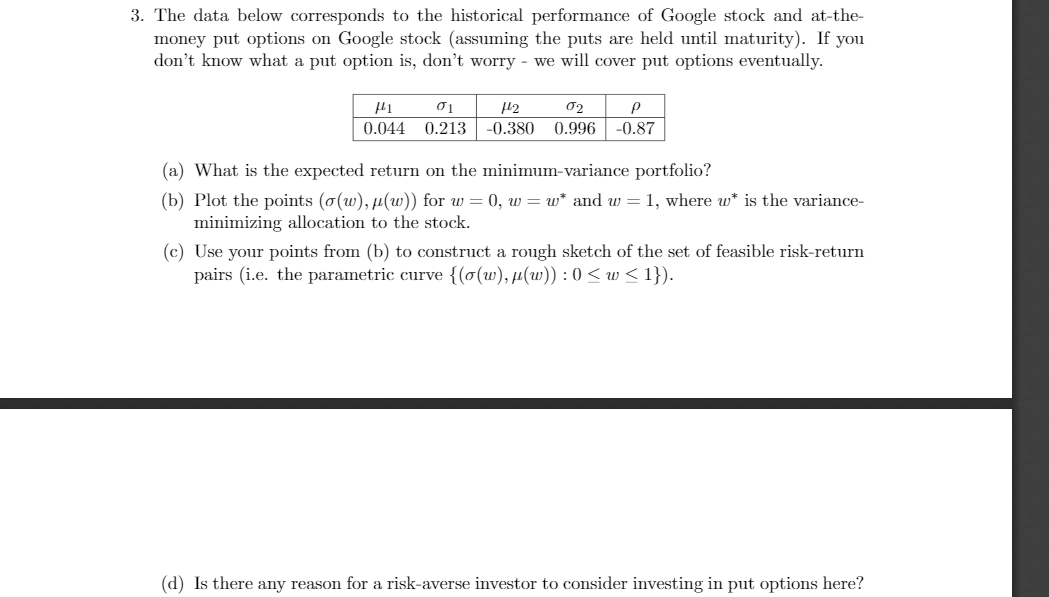
3. The data below corresponds to the historical performance of Google stock and at-the- money put options on Google stock (assuming the puts are

3. The data below corresponds to the historical performance of Google stock and at-the- money put options on Google stock (assuming the puts are held until maturity). If you don't know what a put option is, don't worry - we will cover put options eventually. 1 12 02 P 01 0.044 0.213 -0.380 0.996 -0.87 (a) What is the expected return on the minimum-variance portfolio? (b) Plot the points (o(w), (w)) for w=0, w = w* and w = 1, where w* is the variance- minimizing allocation to the stock. (c) Use your points from (b) to construct a rough sketch of the set of feasible risk-return pairs (i.e. the parametric curve {(o(w), (w)): 0 w 1}). (d) Is there any reason for a risk-averse investor to consider investing in put options here?
Step by Step Solution
★★★★★
3.30 Rating (153 Votes )
There are 3 Steps involved in it
Step: 1
a To calculate the expected return on the minimumvariance portfolio Let w weight on stock 1w weight ...
Get Instant Access to Expert-Tailored Solutions
See step-by-step solutions with expert insights and AI powered tools for academic success
Step: 2

Step: 3

Ace Your Homework with AI
Get the answers you need in no time with our AI-driven, step-by-step assistance
Get Started


