Question
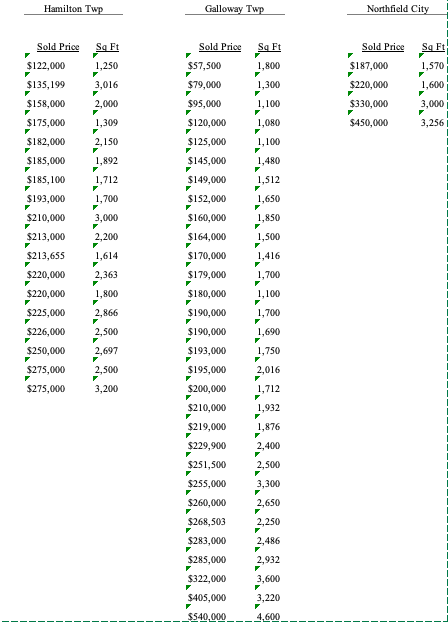
3. The data for Single Family Home sales in 3 areas (Hamilton and Galloway Townships and Northfield City) for the period of January 1, 2012
3. The data for Single Family Home sales in 3 areas (Hamilton and Galloway Townships and Northfield City) for the period of January 1, 2012 and April 19, 2012 is available on Blackboard. The data consists of the sales price and the square footage of each home sold.
a. Find the correlation coefficient between the sold price and square footage for each area and test the significance of the correlation. Use a level of significance of 0.05.
b. For each area that has a significant correlation, find the equation for the regression line. Make a scatter plot of the data and draw the regression line on the plot. (ONLY for data with significant correlation! Additional plots will be marked incorrect.

Step by Step Solution
There are 3 Steps involved in it
Step: 1

Get Instant Access to Expert-Tailored Solutions
See step-by-step solutions with expert insights and AI powered tools for academic success
Step: 2

Step: 3

Ace Your Homework with AI
Get the answers you need in no time with our AI-driven, step-by-step assistance
Get Started


