

Answered step by step
Verified Expert Solution
Question
1 Approved Answer
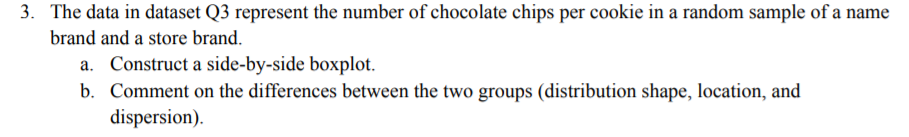
3. The data in dataset Q3 represent the number of chocolate chips per cookie in a random sample of a name brand and a store

Step by Step Solution
There are 3 Steps involved in it
Step: 1

Get Instant Access to Expert-Tailored Solutions
See step-by-step solutions with expert insights and AI powered tools for academic success
Step: 2

Step: 3
Ace Your Homework with AI
Get the answers you need in no time with our AI-driven, step-by-step assistance
Get Started
Differential Topology
Authors: Amiya Mukherjee
2nd Edition
3319190458, 9783319190457