Answered step by step
Verified Expert Solution
Question
1 Approved Answer
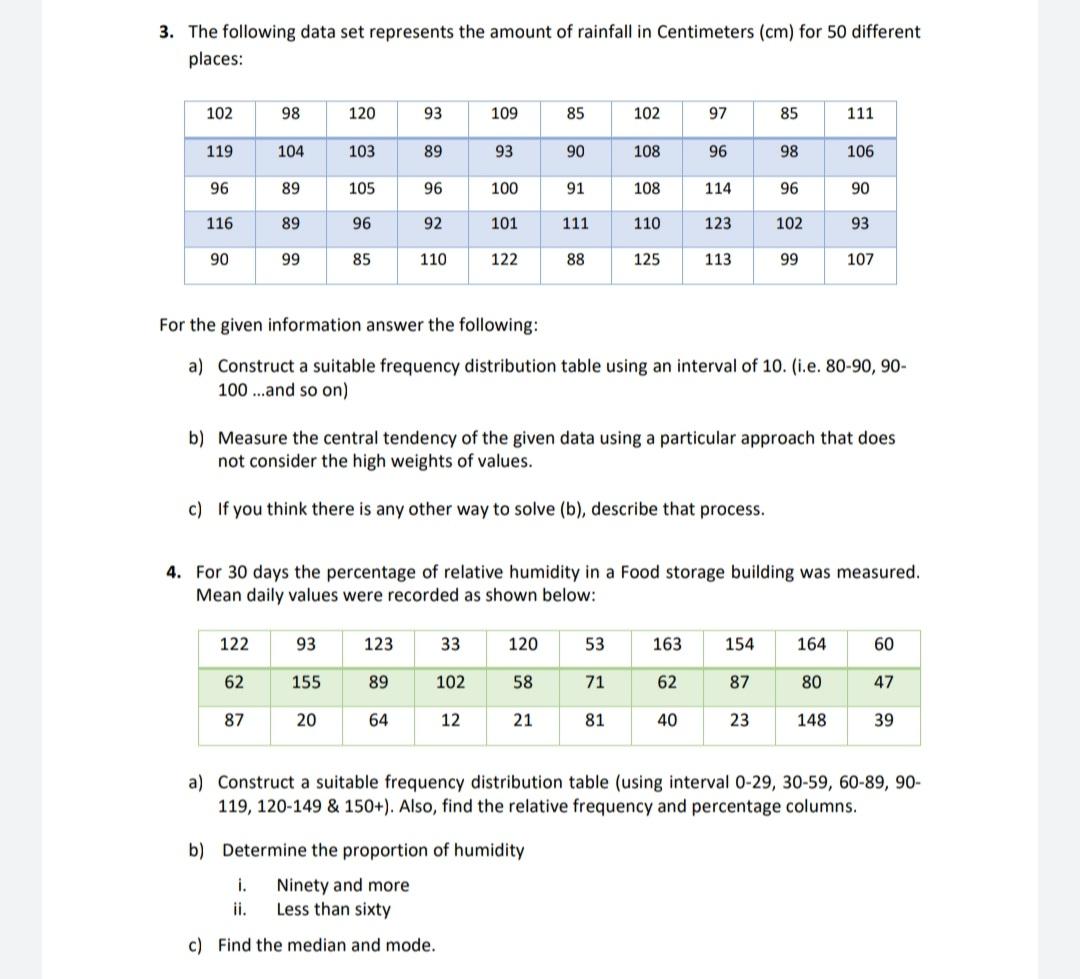
3. The following data set represents the amount of rainfall in Centimeters (cm) for 50 different places: 102 98 120 93 109 85 102

3. The following data set represents the amount of rainfall in Centimeters (cm) for 50 different places: 102 98 120 93 109 85 102 97 85 111 119 104 103 89 93 90 108 96 98 106 96 89 105 96 100 91 108 114 96 90 116 89 96 92 101 111 110 123 102 93 90 99 85 110 122 88 125 113 99 107 For the given information answer the following: a) Construct a suitable frequency distribution table using an interval of 10. (i.e. 80-90, 90- 100 .and so on) b) Measure the central tendency of the given data using a particular approach that does not consider the high weights of values. c) If you think there is any other way to solve (b), describe that process. 4. For 30 days the percentage of relative humidity in a Food storage building was measured. Mean daily values were recorded as shown below: 122 93 123 33 120 53 163 154 164 60 62 155 89 102 58 71 62 87 80 47 87 20 64 12 21 81 40 23 148 39 a) Construct a suitable frequency distribution table (using interval 0-29, 30-59, 60-89, 90- 119, 120-149 & 150+). Also, find the relative frequency and percentage columns. b) Determine the proportion of humidity i. Ninety and more Less than sixty ii. c) Find the median and mode.
Step by Step Solution
★★★★★
3.32 Rating (149 Votes )
There are 3 Steps involved in it
Step: 1
3 Amount of Rain fall is denoted by x a First we arrange data in Ascending order f...
Get Instant Access to Expert-Tailored Solutions
See step-by-step solutions with expert insights and AI powered tools for academic success
Step: 2

Step: 3

Ace Your Homework with AI
Get the answers you need in no time with our AI-driven, step-by-step assistance
Get Started


