

Question
3. The frequencies of disease and exposure status are arranged in the following table. Exposure Disease status status D D noo no1 no- 110
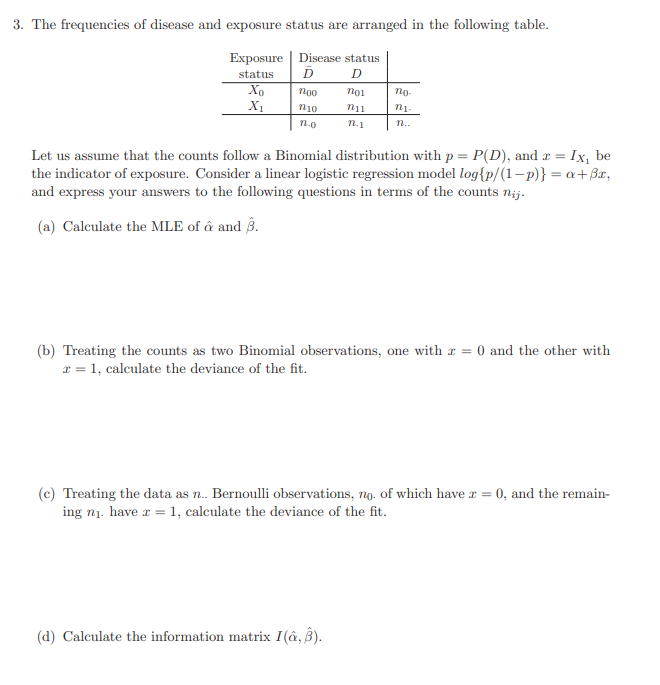
3. The frequencies of disease and exposure status are arranged in the following table. Exposure Disease status status D D noo no1 no- 110 n11 n1- 12.0 12.1 n.. Ix, be Let us assume that the counts follow a Binomial distribution with p = P(D), and x = the indicator of exposure. Consider a linear logistic regression model log{p/(1-p)} = a+x, and express your answers to the following questions in terms of the counts nij. (a) Calculate the MLE of and B. (b) Treating the counts as two Binomial observations, one with x=0 and the other with x=1, calculate the deviance of the fit. (c) Treating the data as n.. Bernoulli observations, no. of which have x = 0, and the remain- ing n. have x = 1, calculate the deviance of the fit. (d) Calculate the information matrix I(, B).
Step by Step Solution
There are 3 Steps involved in it
Step: 1

Get Instant Access with AI-Powered Solutions
See step-by-step solutions with expert insights and AI powered tools for academic success
Step: 2

Step: 3
Ace Your Homework with AI
Get the answers you need in no time with our AI-driven, step-by-step assistance
Get Started
Numerical Analysis
Authors: Richard L. Burden, J. Douglas Faires
9th edition
978-0538733519