Answered step by step
Verified Expert Solution
Question
1 Approved Answer
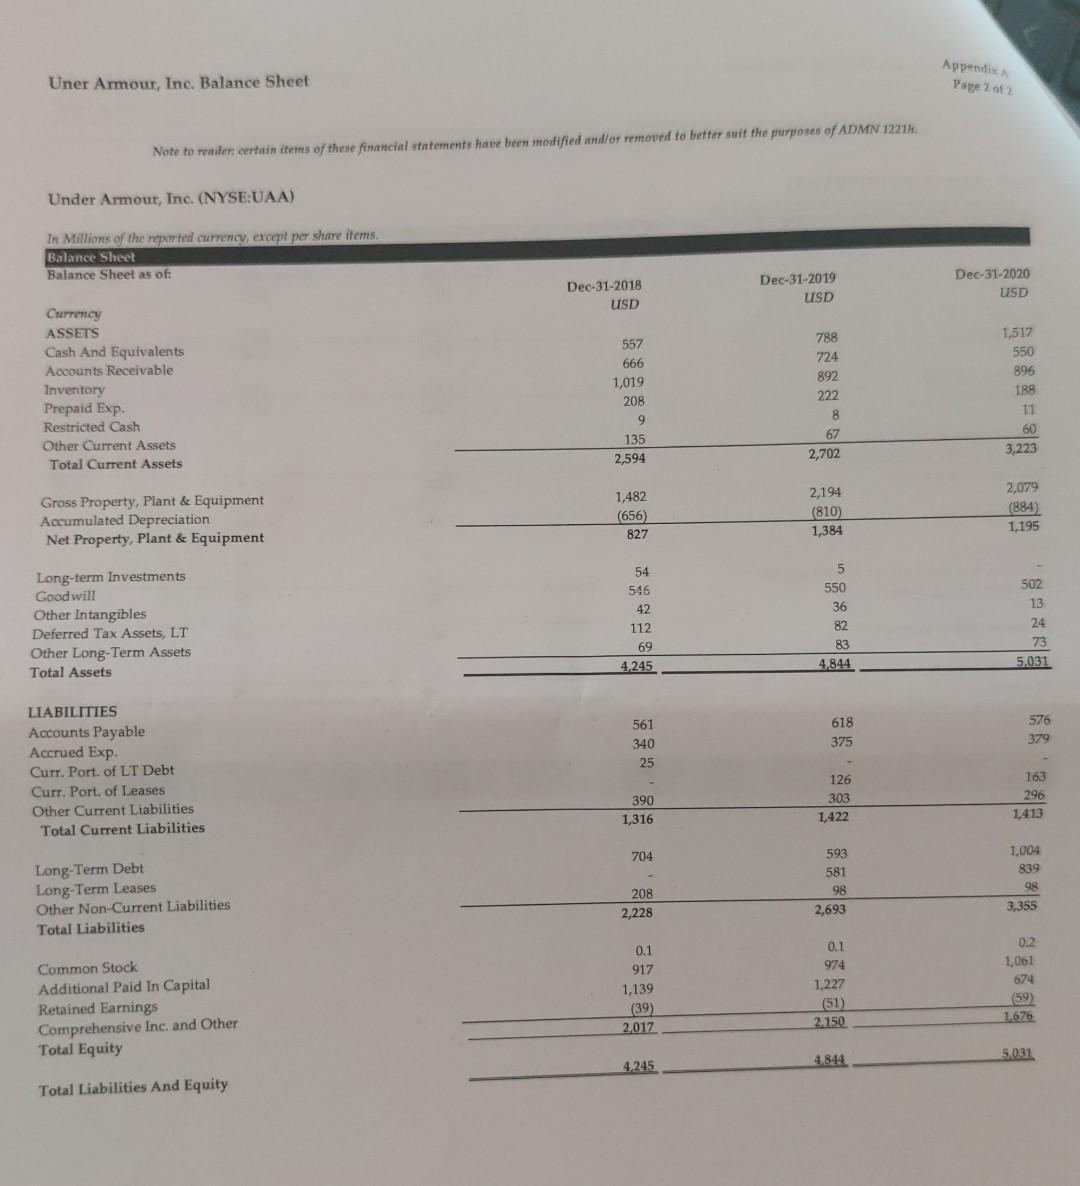
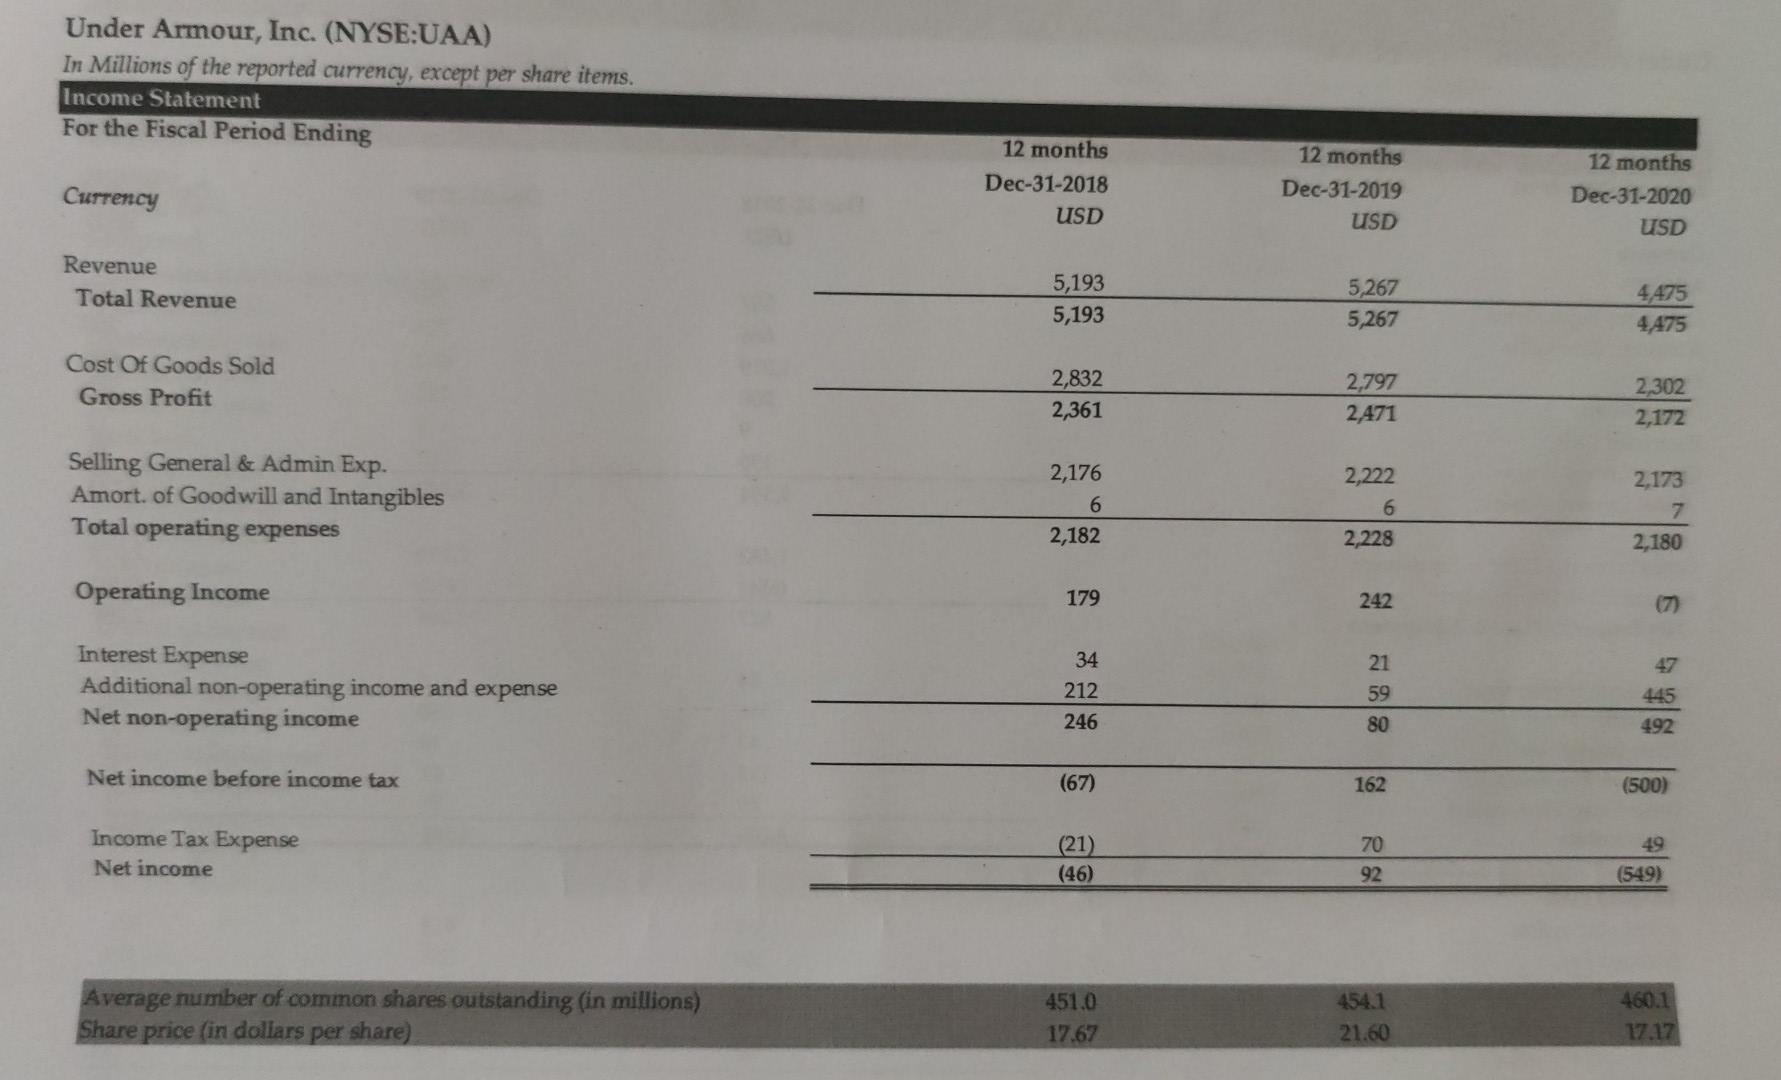
3 The income statements and balance sheets from 2018-2020 for Under Armour Inc. are attached as Appendix A to this test. Calculate the following metrics


3 The income statements and balance sheets from 2018-2020 for Under Armour Inc. are attached as Appendix A to this test. Calculate the following metrics for Under Armour. For each metric, briefly state whether it indicates that solvency, liquidity, or profitability is improving or deteriorating: a) Current ratio for 2019 and 2020. b) Debt to total assets for 2019 and 2020. c) Price to earnings for 2019 and 2020. Note 1 - I have included additional information on the income statement to help you calculate this ratio. Note 2 - You do not need to comment on whether this indicates deterioration or improvement in financial condition. d) Days in inventory for 2019 and 2020. e) Gross profit margin for 2019 and 2020. f) Profit margin for 2019 and 2020. Uner Armour, Inc Balance Sheet Appendix Page 2 of 2 Note to reader certain items of these financial statements have been modified and/or removed to better suit the purposes of ADMN 1221h. Under Armour, Inc. (NYSE:UAA) In Millions of the reported currency, except per share items Balance Sheet Balance Sheet as of: Dec-31-2018 USD Dec-31-2019 USD Dec-31-2020 USD Currency ASSETS Cash And Equivalents Accounts Receivable Inventory Prepaid Exp Restricted Cash Other Current Assets Total Current Assets 557 666 1,019 208 9 135 2,594 788 724 892 222 8 67 2,702 1,517 550 896 188 11 60 3,223 Gross Property, Plant & Equipment Accumulated Depreciation Net Property, Plant & Equipment 1,482 (656) 827 2,194 (810) 1,384 2,079 (884) 1,195 Long-term Investments Goodwill Other Intangibles Deferred Tax Assets, LT Other Long-Term Assets Total Assets 54 545 42 112 69 4,245 5 550 36 82 83 4,844 502 13 24 73 5,031 561 340 25 618 375 576 379 - LIABILITIES Accounts Payable Accrued Exp Curr. Port of LT Debt Curr. Port of Leases Other Current Liabilities Total Current Liabilities 390 1,316 126 303 1,422 163 296 1413 Long-Term Debt Long-Term Leases Other Non-Current Liabilities Total Liabilities 704 - 208 2,228 593 581 98 2,693 1,004 839 98 3,355 Common Stock Additional Paid In Capital Retained Earnings Comprehensive Inc. and Other Total Equity 0.1 917 1,139 (39) 2,017 0.1 974 1,227 (51) 2.150 0.2 1,061 674 (59) 1.676 5,031 4.245 4.844 Total Liabilities And Equity Under Armour, Inc. (NYSE:UAA) In Millions of the reported currency, except per share items. Income Statement For the Fiscal Period Ending 12 months Dec-31-2018 USD Currency 12 months Dec-31-2019 USD 12 months Dec-31-2020 USD Revenue Total Revenue 5,193 5,193 5,267 5,267 4,475 4,475 Cost Of Goods Sold Gross Profit 2,832 2,361 2,797 2,471 2,302 2,172 Selling General & Admin Exp. Amort. of Goodwill and Intangibles Total operating expenses 2,176 6 2,182 2,222 6 2,228 2,173 7 2,180 Operating Income 179 242 (7) Interest Expense Additional non-operating income and expense Net non-operating income 34 212 21 59 80 47 445 492 246 Net income before income tax (67) 162 (500) Income Tax Expense Net income 70 (21) (46) 49 (549) Average number of common shares outstanding (in millions) Share price (in dollars per share) 451.0 17.67 454.1 21.60 460.1 17.17
Step by Step Solution
There are 3 Steps involved in it
Step: 1

Get Instant Access to Expert-Tailored Solutions
See step-by-step solutions with expert insights and AI powered tools for academic success
Step: 2

Step: 3

Ace Your Homework with AI
Get the answers you need in no time with our AI-driven, step-by-step assistance
Get Started


