Question
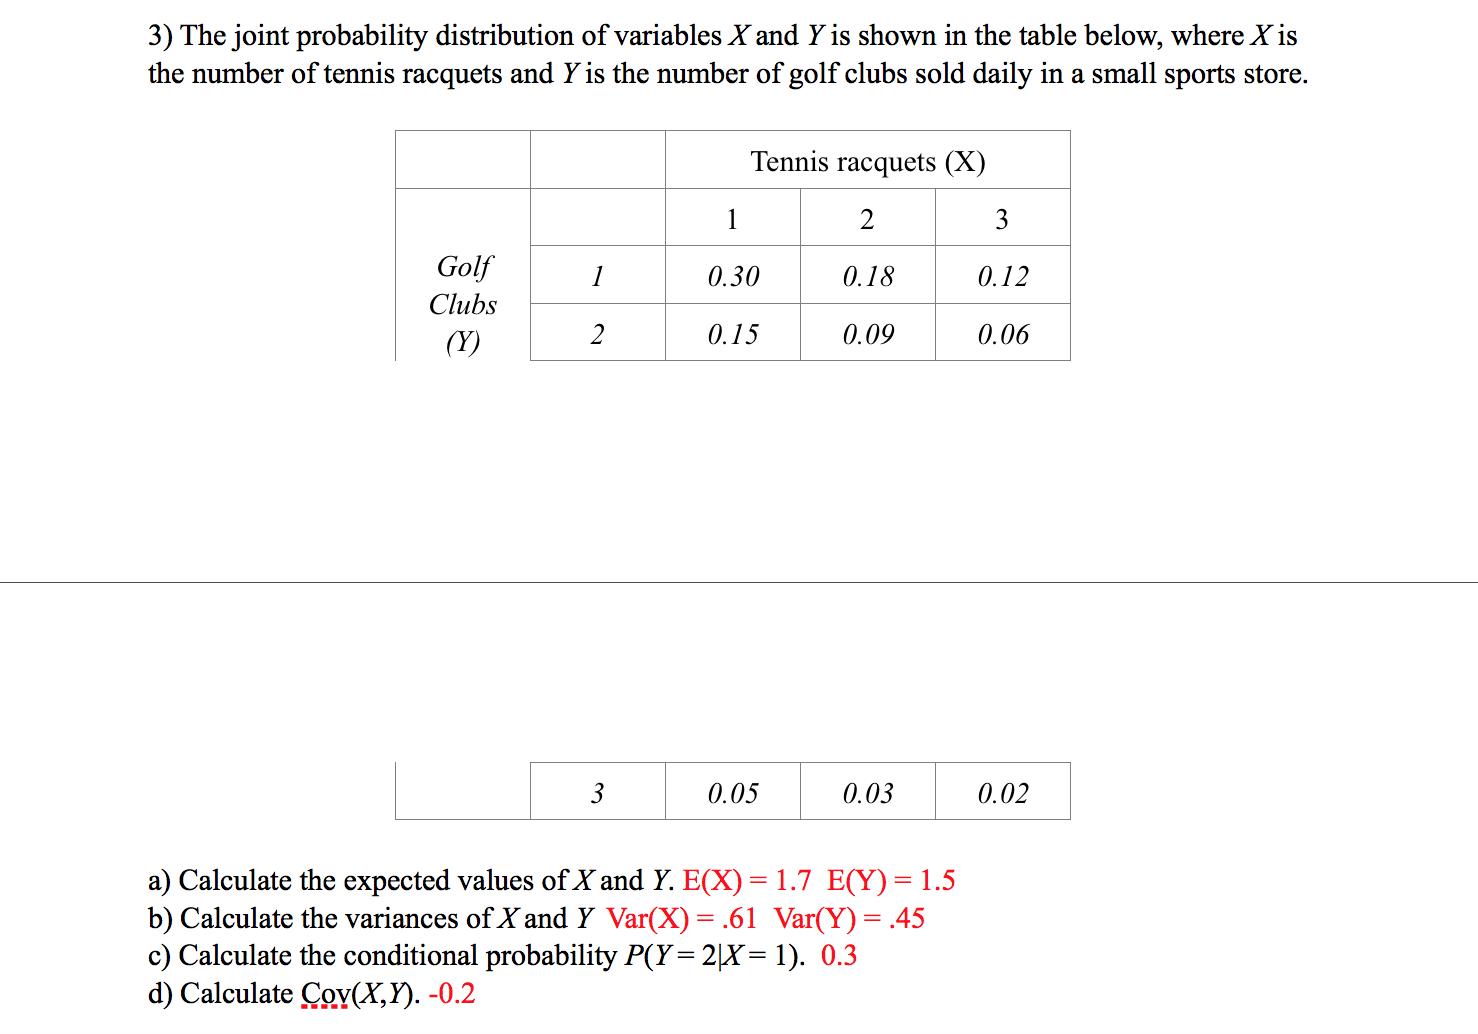
3) The joint probability distribution of variables X and Y is shown in the table below, where X is the number of tennis racquets

3) The joint probability distribution of variables X and Y is shown in the table below, where X is the number of tennis racquets and Y is the number of golf clubs sold daily in a small sports store. Tennis racquets (X) 1 2 3 Golf 1 0.30 0.18 0.12 Clubs 2 (Y) 0.15 0.09 0.06 3 0.05 0.03 0.02 a) Calculate the expected values of X and Y. E(X) = 1.7 E(Y) = 1.5 b) Calculate the variances of X and Y Var(X) = .61 Var(Y) = .45 c) Calculate the conditional probability P(Y= 2|X= 1). 0.3 d) Calculate Cov(X,Y). -0.2
Step by Step Solution
There are 3 Steps involved in it
Step: 1

Get Instant Access to Expert-Tailored Solutions
See step-by-step solutions with expert insights and AI powered tools for academic success
Step: 2

Step: 3

Ace Your Homework with AI
Get the answers you need in no time with our AI-driven, step-by-step assistance
Get StartedRecommended Textbook for
Statistics For Engineers And Scientists
Authors: William Navidi
4th Edition
73401331, 978-0073401331
Students also viewed these Marketing questions
Question
Answered: 1 week ago
Question
Answered: 1 week ago
Question
Answered: 1 week ago
Question
Answered: 1 week ago
Question
Answered: 1 week ago
Question
Answered: 1 week ago
Question
Answered: 1 week ago
Question
Answered: 1 week ago
Question
Answered: 1 week ago
Question
Answered: 1 week ago
Question
Answered: 1 week ago
Question
Answered: 1 week ago
Question
Answered: 1 week ago
Question
Answered: 1 week ago
Question
Answered: 1 week ago
Question
Answered: 1 week ago
Question
Answered: 1 week ago
Question
Answered: 1 week ago
Question
Answered: 1 week ago
Question
Answered: 1 week ago
Question
Answered: 1 week ago
View Answer in SolutionInn App


