Answered step by step
Verified Expert Solution
Question
1 Approved Answer
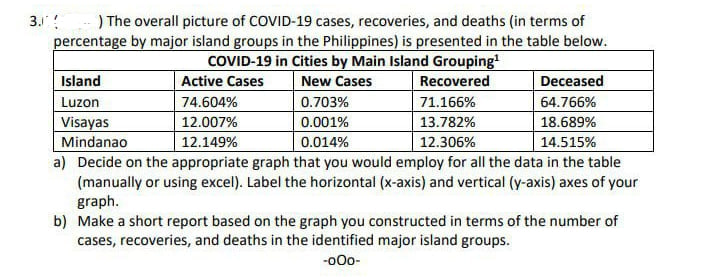
3. ) The overall picture of COVID-19 cases, recoveries, and deaths (in terms of percentage by major island groups in the Philippines) is presented

3. ) The overall picture of COVID-19 cases, recoveries, and deaths (in terms of percentage by major island groups in the Philippines) is presented in the table below. COVID-19 in Cities by Main Island Grouping Island Luzon Visayas Mindanao Active Cases 74.604% 12.007% 12.149% New Cases 0.703% 0.001% 0.014% Recovered 71.166% 13.782% 12.306% Deceased 64.766% 18.689% 14.515% a) Decide on the appropriate graph that you would employ for all the data in the table (manually or using excel). Label the horizontal (x-axis) and vertical (y-axis) axes of your graph. b) Make a short report based on the graph you constructed in terms of the number of cases, recoveries, and deaths in the identified major island groups. -000-
Step by Step Solution
★★★★★
3.42 Rating (152 Votes )
There are 3 Steps involved in it
Step: 1
a A bar graph would be the most appropriate graph to employ for all the data in the table The horizontal axis xaxis should be labeled Island Group and ...
Get Instant Access to Expert-Tailored Solutions
See step-by-step solutions with expert insights and AI powered tools for academic success
Step: 2

Step: 3

Ace Your Homework with AI
Get the answers you need in no time with our AI-driven, step-by-step assistance
Get Started


