Answered step by step
Verified Expert Solution
Question
1 Approved Answer
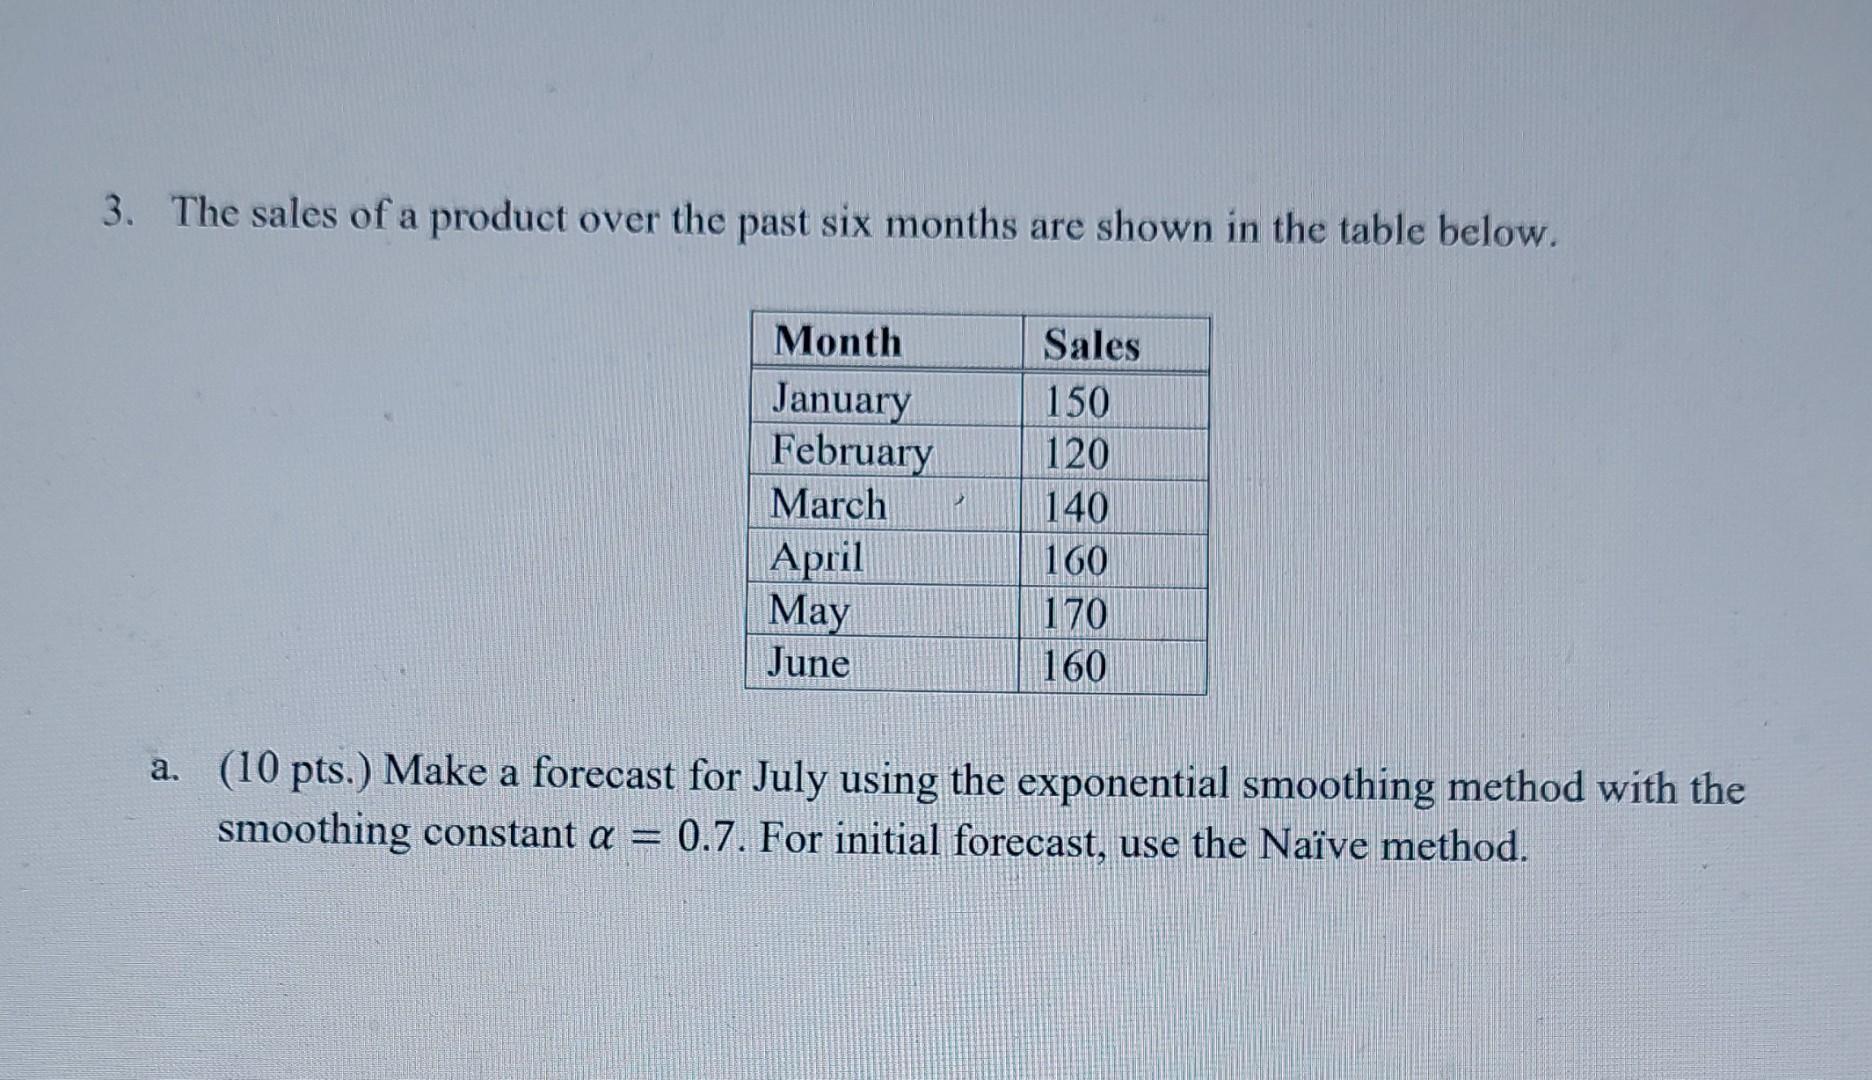
3. The sales of a product over the past six months are shown in the table below. Month January February March April May June Sales


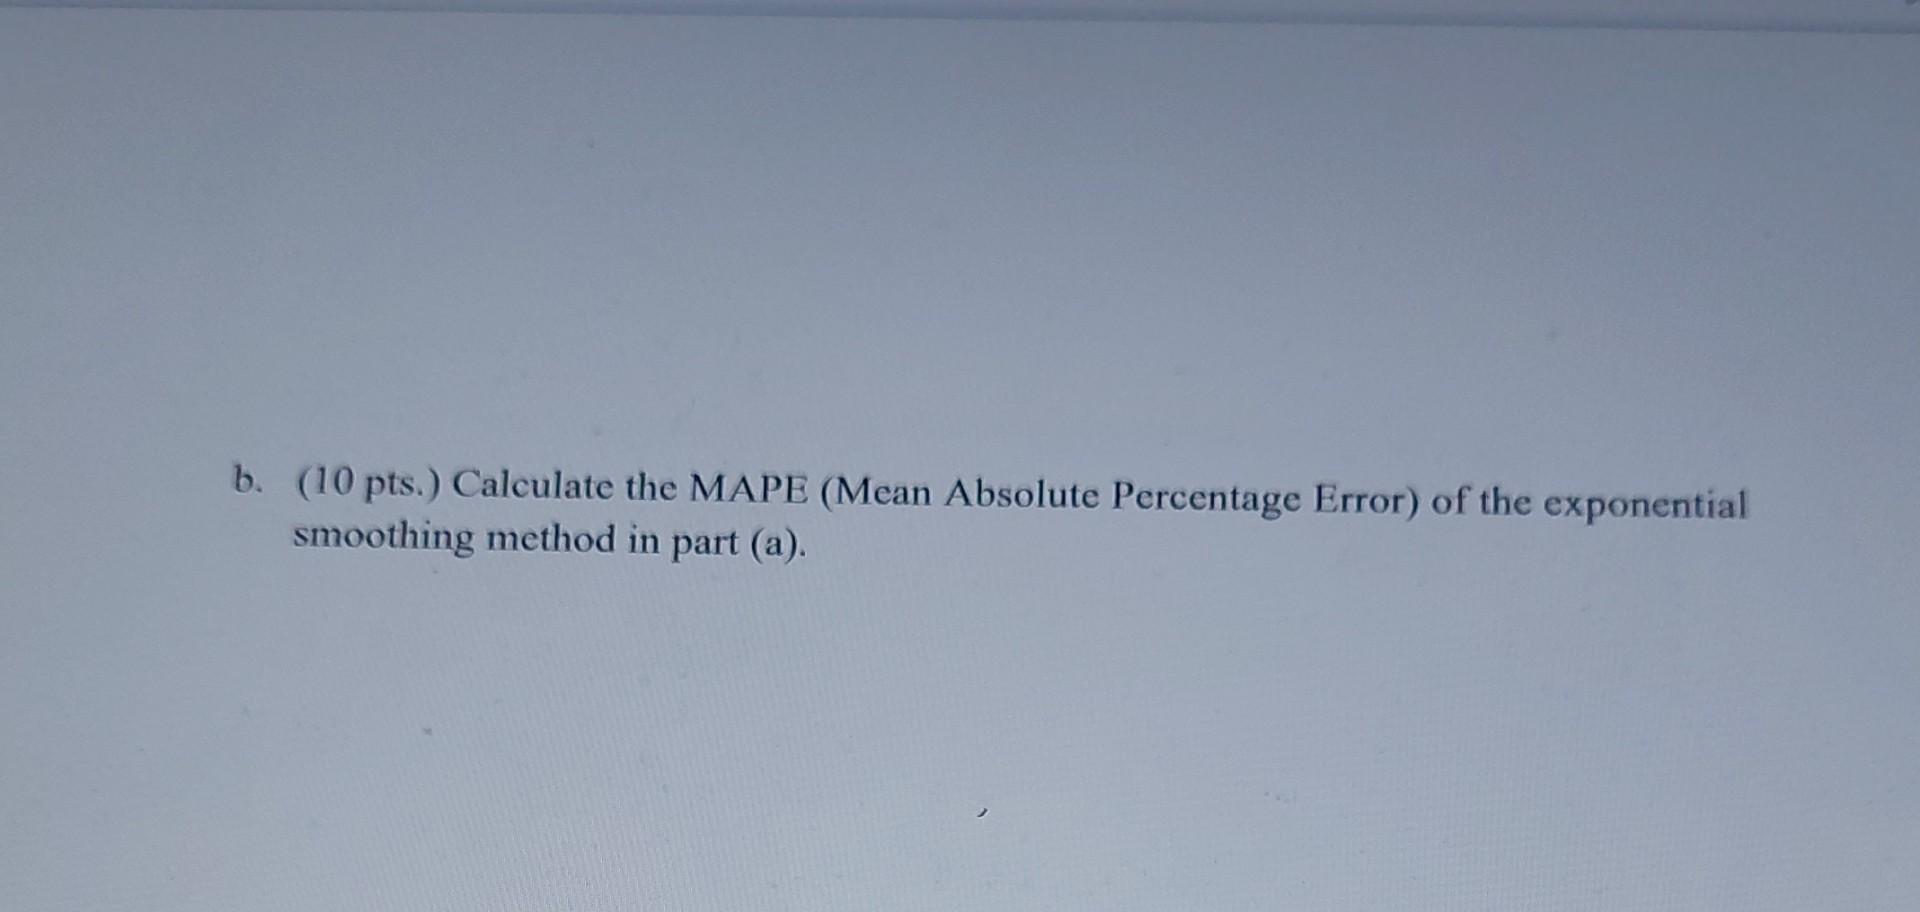
3. The sales of a product over the past six months are shown in the table below. Month January February March April May June Sales 150 120 140 160 170 160 a. (10 pts.) Make a forecast for July using the exponential smoothing method with the smoothing constant a = 0.7. For initial forecast, use the Nave method. b. (10 pts.) Calculate the MAPE (Mean Absolute Percentage Error) of the exponential smoothing method in part (a)
Step by Step Solution
There are 3 Steps involved in it
Step: 1

Get Instant Access to Expert-Tailored Solutions
See step-by-step solutions with expert insights and AI powered tools for academic success
Step: 2

Step: 3

Ace Your Homework with AI
Get the answers you need in no time with our AI-driven, step-by-step assistance
Get Started


