Question
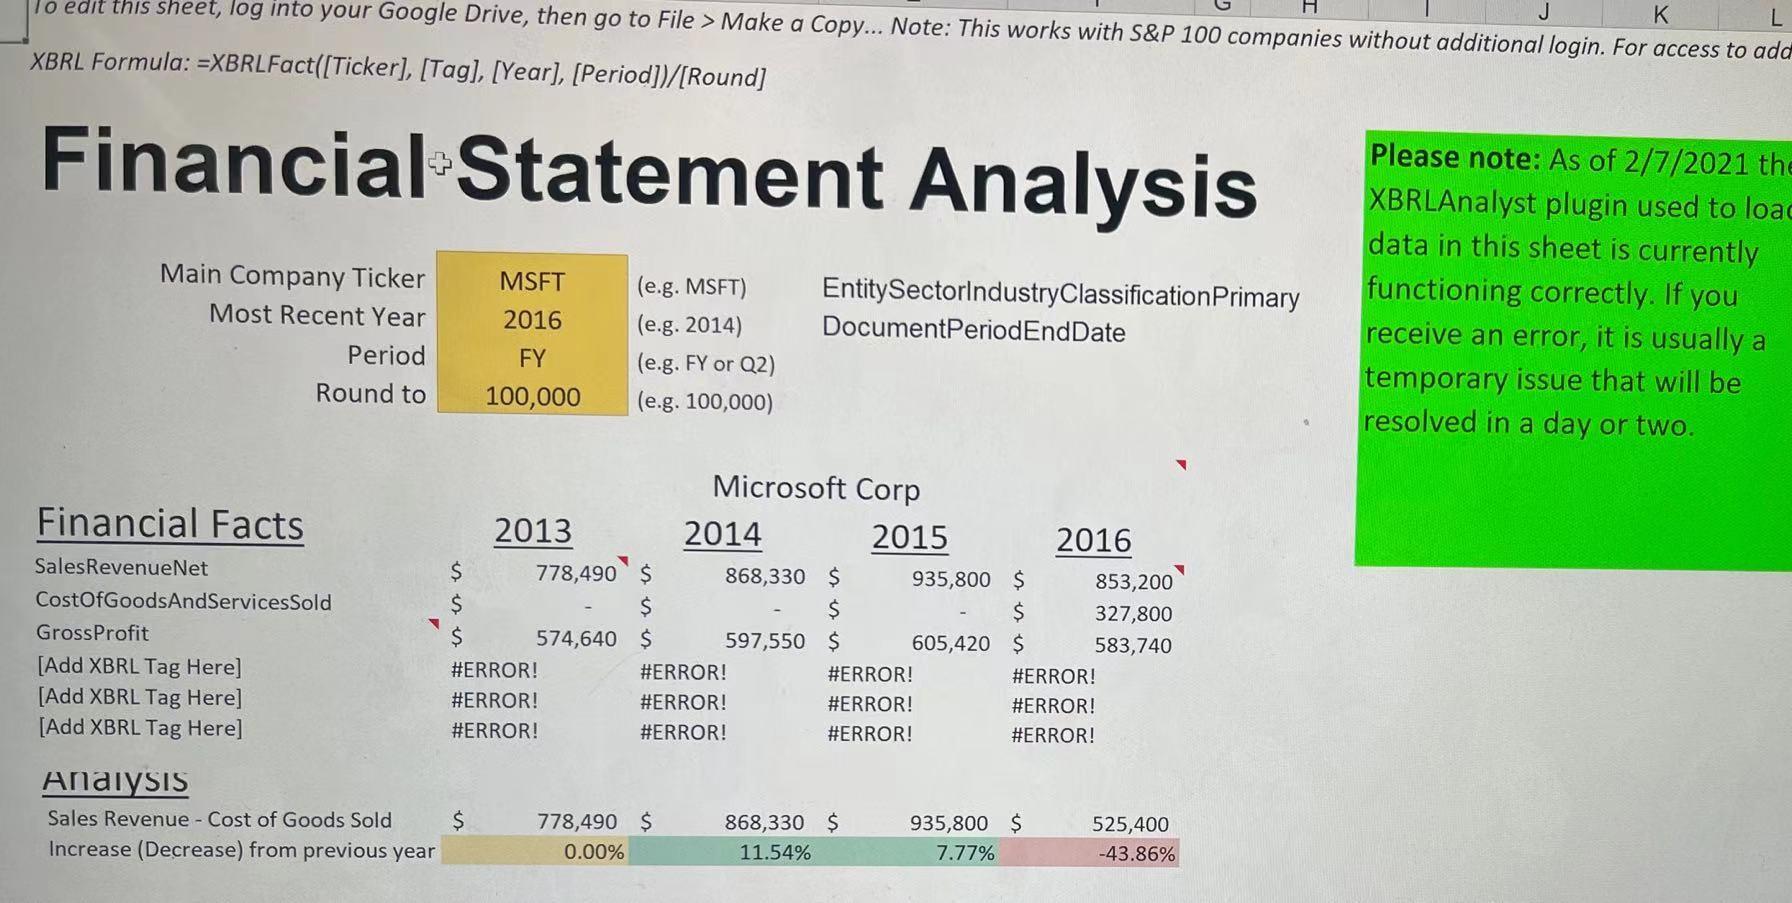
3). Try to answer the following three questions using the google sheet data by following the instruction in Lab1.pdf . You will first need to
3). Try to answer the following three questions using the google sheet data by following the instruction in "Lab1.pdf ". You will first need to find the XBRL tag through searching "xbrlview.fasb.org" to get the financial statement items to calculate the financial measures you need for the following three questions. Note: You cannot click the link in "Lab1.pdf" as the link in the file is not active. Just type this website in your browser.
Q1: Has [Company Xs] gross profit margin (net sales revenue minus cost of good sold) increased from 2013 to 2016?
Q2: Has [Company X's] current ratio (current assets divided by current liabilities) increased from 2013 to 2016?
Q3: Has [Company X's] debt-to-equity (total debt divided by total equity) ratio decreased from 2013 to 2016?
Note: Please see"More guidance for Lab 1.docx " about how to calculate the financial ratios using "Financial Statement Analysis " Google sheet and the related XBRL tag names you need for the questions above.
4). Minimum submission requirements: Create and submit a word file (name the file "Lab1" and your name) that includes screenshots and your answers to your three questions. Please format your document the same way in this sample document .
Please include the following screenshots to support your answer:
a. Part 2, step 11: take screenshots like Exhibit 1-1A after you navigate the website "xbrlview.fasb.org" to show how you identify related XBRL tags to calculate gross margin, current ratio, or debt-to-equity ratio to answer each of the above three questions.
b. Part 3, step 17: take a screenshot of Google sheet after you add XBRL tags to calculate the ratios in question Q1 to Q3. To show the change of the financial measures over years in Q1 and Q3, you can calculate % changes from one year to next year or plot the trend of the measure to show how it changes over the period 2013-2016. You can also use your own excel sheet for the calculation of changes or plot the trend once you get the data from Google sheet.
Step by Step Solution
There are 3 Steps involved in it
Step: 1

Get Instant Access to Expert-Tailored Solutions
See step-by-step solutions with expert insights and AI powered tools for academic success
Step: 2

Step: 3

Ace Your Homework with AI
Get the answers you need in no time with our AI-driven, step-by-step assistance
Get Started


