Answered step by step
Verified Expert Solution
Link Copied!

Question

1 Approved Answer

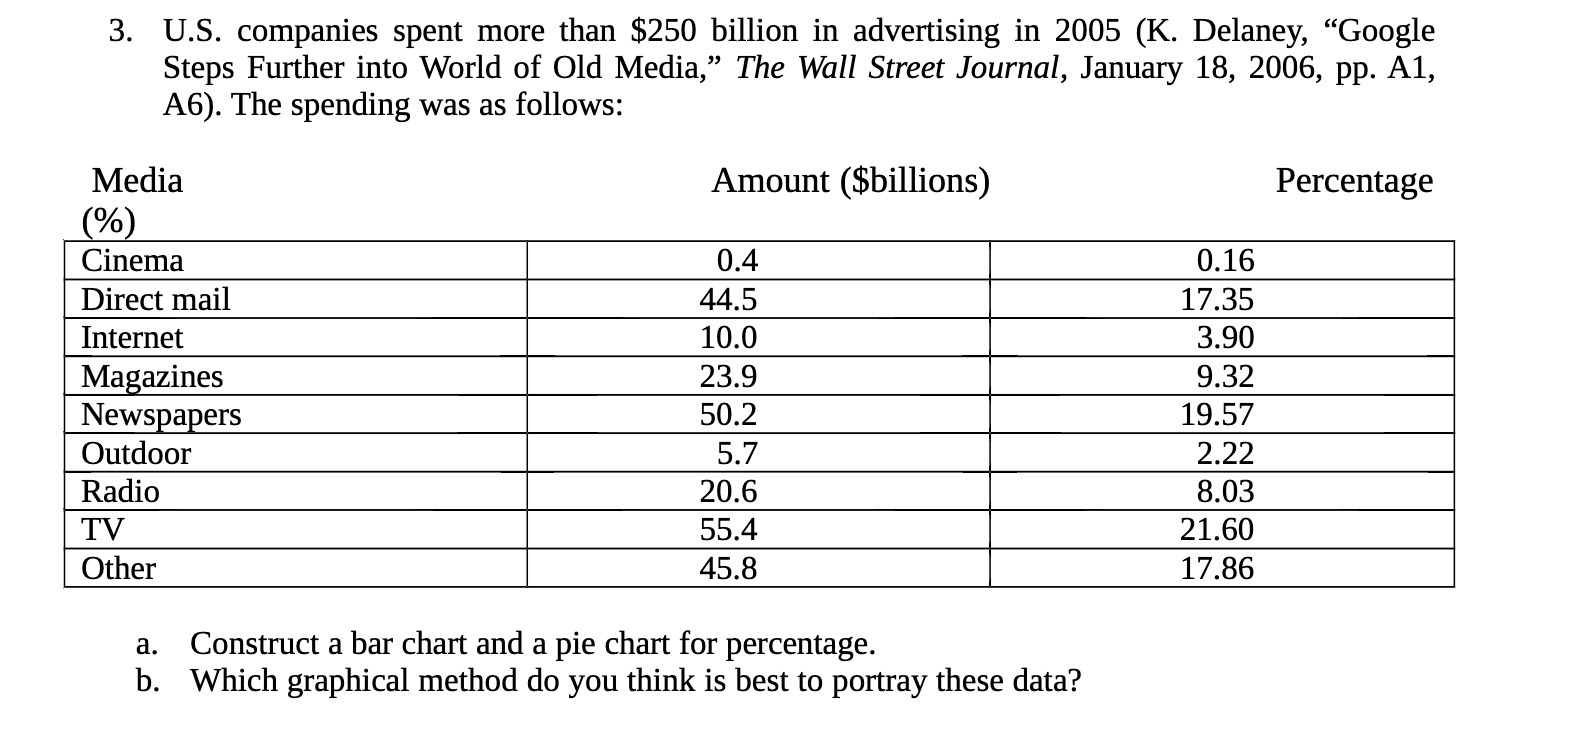
3. US. companies spent more than $250 billion in advertising in 2005 (K. Delaney, Google Steps Further into World of Old Media, The Wall Street

image text in transcribed
3. US. companies spent more than $250 billion in advertising in 2005 (K. Delaney, \"Google Steps Further into World of Old Media,\" The Wall Street Journal, January 18, 2006, pp. A1, A6). The spending was as follows: Media Amount ($billions) Percentage % Cinema Direct mail Internet Ma-azines News-nets Outdoor Radio 20.6 8.03 TV 55.4 21.60 Other 45.8 17.86 a. Construct a bar chart and a pie chart for percentage. b. Which graphical method do you think is best to portray these data

Step by Step Solution

There are 3 Steps involved in it

Step: 1

blur-text-image

Get Instant Access to Expert-Tailored Solutions

See step-by-step solutions with expert insights and AI powered tools for academic success

Step: 2

blur-text-image

Step: 3

blur-text-image

Ace Your Homework with AI

Get the answers you need in no time with our AI-driven, step-by-step assistance

Get Started

Recommended Textbook for

Principles of Managerial Finance

Authors: Chad J. Zutter, Scott B. Smart

15th edition

013447631X, 134476315, 9780134478197 , 978-0134476315

More Books

Students also viewed these Mathematics questions

Question

What is the difference between a policy, a rule, and a procedure?

Answered: 1 week ago

Question

8. What are the costs of collecting the information?

Answered: 1 week ago

Question

1. Build trust and share information with others.

Answered: 1 week ago