

Answered step by step
Verified Expert Solution
Question
1 Approved Answer
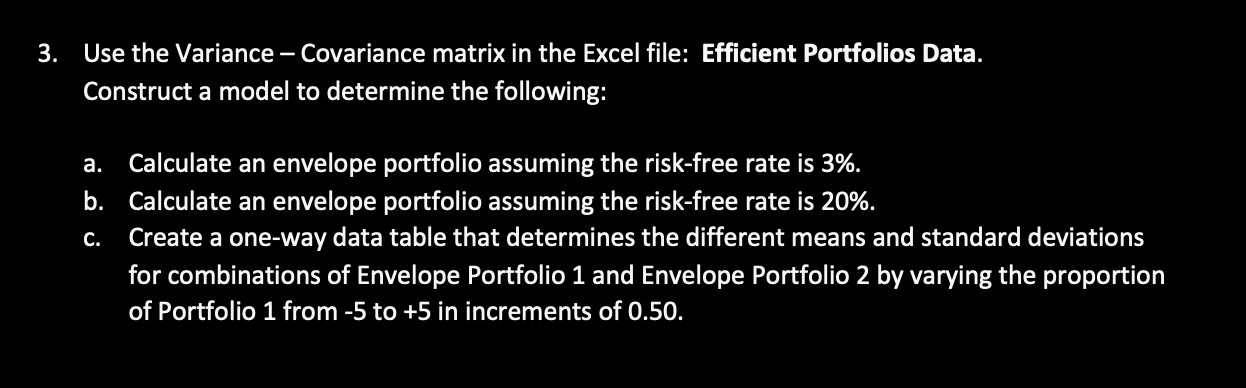
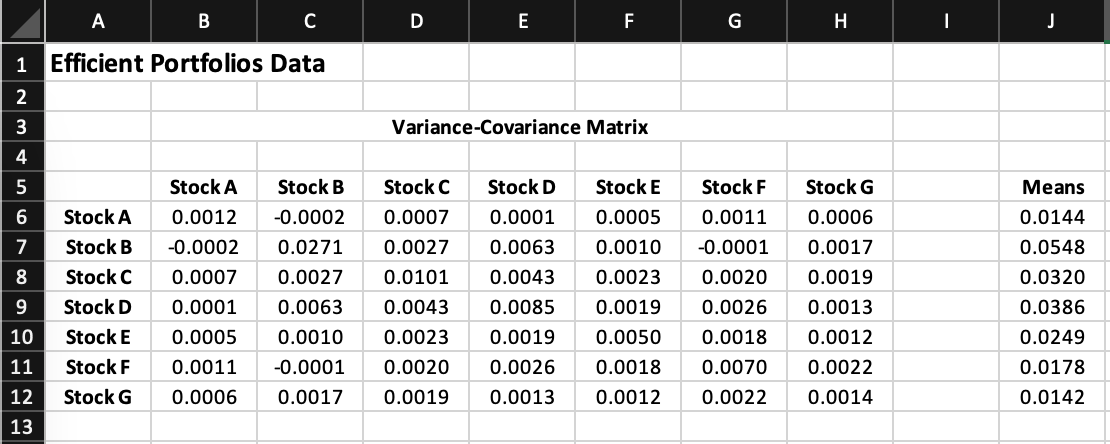
3. Use the Variance - Covariance matrix in the Excel file: Efficient Portfolios Data. Construct a model to determine the following: a. C. Calculate an
Step by Step Solution
There are 3 Steps involved in it
Step: 1

Get Instant Access to Expert-Tailored Solutions
See step-by-step solutions with expert insights and AI powered tools for academic success
Step: 2

Step: 3
Ace Your Homework with AI
Get the answers you need in no time with our AI-driven, step-by-step assistance
Get Started
Finance Theory And Practice
Authors: Anne Marie Ward
2nd Edition
1907214259, 978-1907214257