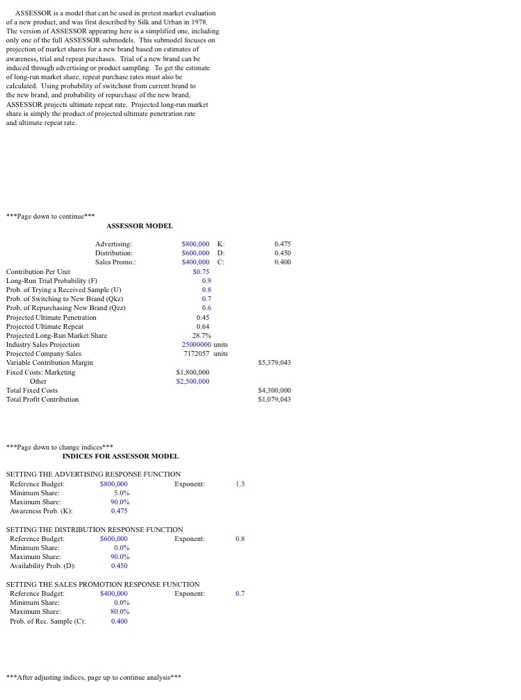
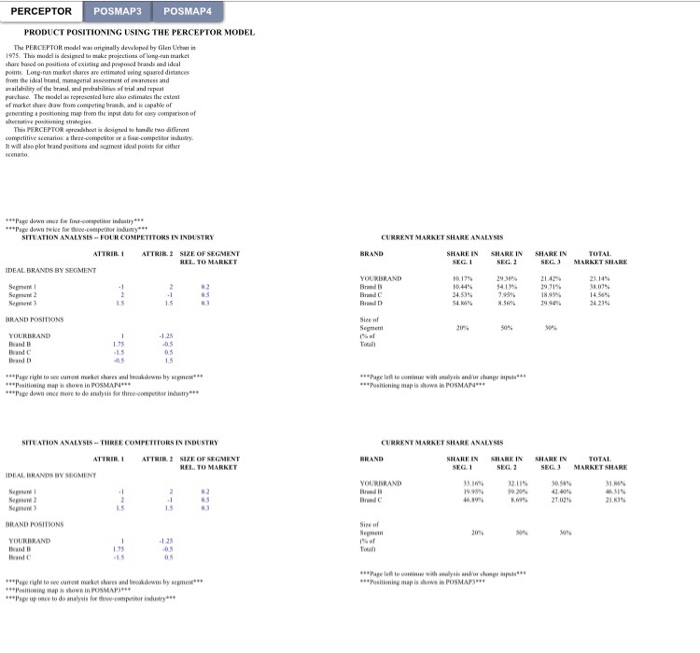
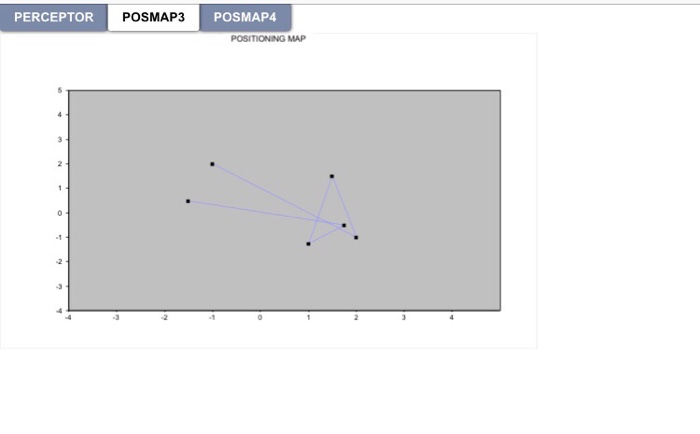
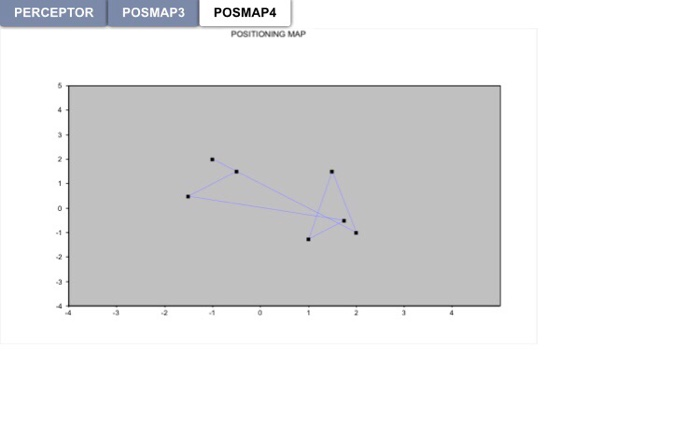
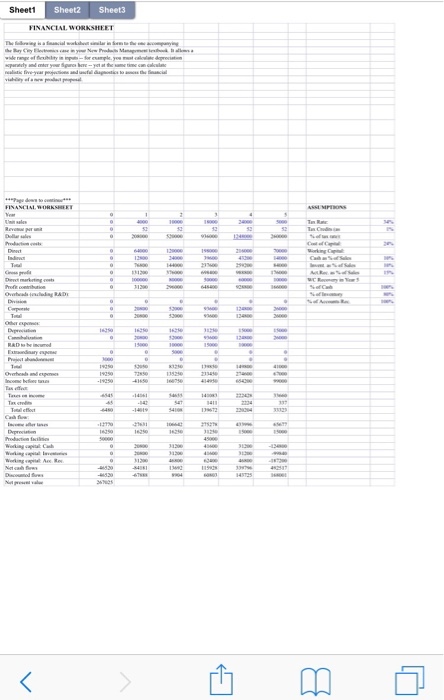
3. Using the FINANCIAL worksheet, do a five-year projection for Dell's Executive PC using market shares obtained from PERCEPTOR or ASSESSOR. Assume the market share projected for Year 1 by PERCEPTOR or ASSESSOR is maintained through Year 5. Hint: When using the FINANCIAL worksheet, make your entries of unit sales in thousands of units, and dollar figures in thousands of dollars. That is, to enter 30 million units, type 30000," or to enter indirect costs of $100,000,000, enter"100000. This minimizes the number of zeroes in the spreadsheet and facilitates interpretation. Caution: Add back the zeroes when obtaining results. So if your NPV shows $2,000,000, it really means $2 billion! ASSESSOR is a model that can be used in pret market valuatice of a new product, and was first described by Silk and Urban in 1978 The version of ASSESSOR appearing here is a simplified ons, including only one of the full ASSESSOR submodels. This submodel focuses on projection of market shares for a new brand based on estimates of eness, trial and repeat purchases Trial of a new brand can be induced though advertising er product sampling. To get the state of long-runmarketc, repeat purchase rates must also be calculated using probability of switchout from current brand the new brand, and probability of repurchase of the new brand ASSESSOR projects w e re mate Projected long run market share is simply the product of projected ultimate penetration rate and ultimate peale. **Pape down to continue ASSESSOR MODEL SNO,000K $600,000 D Advertising Distribution Sales Promo Contribution Per Unit Long-Run Trial Probability (F) Prob. of Trying a Received Sample (U) Prob. of Switching to New Brand (Ok) Prob. of Repurchasing New Brand (O ) Projected Ultimate Penetration Projected imate Repeat Projected Long Run Market Share Industry Sales Projection Projected Company Sales Variable Contribution Margin Fixed Costs: Marketing 0.45 25000000 units 7172057 units 55.379,043 $1.800.000 $2.500.000 Total Fixed Costs Total Profit Contribution S4300.000 $1,079,043 Page down to change indiges INDICES FOR ASSESSOR MODEL SETTING THE ADVERTISING RESPONSE FUNCTION Reference Badget: SN00,000 Esponent Minimum Share: Maximum Share: Awareness Prohk 0475 50 SETTING THE DISTRIBUTION RESPONSE FUNCTION Reference Badget: 5600.000 Exponent Maximum Share Expo SETTING THE SALES PROMOTION RESPONSE FUNCTION Reference Budget 5400 DCO Minimum Share: Maximum Share: 0.0 Prob. of Rec Sample (C) ***After adjusting indices up to continue asis PERCEPTOR POSMAP3 POSMAP4 PRODUCT POSITIONING USING THE PERCEPTOR MODEL The PERCEPTOR model r ally developed by Glen Coin 1975. The model is dood to make project of man miel har den positiofend p a didideal pois. Legru market stures are estimating we distances frente dal bondag nalassement s and ability of the w eb of trial and repeat purchase. The model de cimates of market show from ting brand paleo penting a posting map from the input data for casy m onof The PERCEPTOR predhod no odliwe different petitive heav 2 lose-comed -tenstest i. It will also plat androitions and seament del pos t er dowe pot indir speedinte SITUATION ANALYSIS FOUR COMPETITORS IN INDUSTRY CURRENT MARKET SHARE ANALYSIS ATTRIR1 ATTRIR. SIZE OF SEGMENT BRAND SHARE IN SHARE IN IDEAL BRANDS BY SEGMENT YOURBRAND 2014 Sement Sement 10.445 34.535 541 7.95% 50% 2143 29.71% 18.99 1456 BRAND POSITIONS Segnem 20. 0 YOURBRAND Ti an w e wanby **Positing map shown in POSMAN Pepe down and more to do analysis for three p rintr- ways Positioning mapishi POSMAN *** SITUATION ANALYSIS THREE COMPETITORS IN INDUSTRY CURRENT MARKET SHARE ANALYSIS ATTRIRI ATTIR, 1 MIZE OF SEGMENT RP TO MARKET RRAND SHARK IN SEG.2 SHARE IN SEGI MARKET SHARE SEGI IDEALINRANNY SEMENT YOURRAND 46 27,00 BRAND POSITIONS Sirof anon YOURRAND an Inc T by wwwwww sing mapishwe is POSMAP Per to rrent markets and *w ing up shown in POSMAP Papp doe s PERCEPTOR POSMAP3 POSMAP4 POSITIONING MAP PERCEPTOR POSMAP3 POSMAP4 POSITIONING MAP Sheet1 Sheet2 Sheet3 FINANCIAL WORKSHEET they yemeyer Me 32 333 33 3. Using the FINANCIAL worksheet, do a five-year projection for Dell's Executive PC using market shares obtained from PERCEPTOR or ASSESSOR. Assume the market share projected for Year 1 by PERCEPTOR or ASSESSOR is maintained through Year 5. Hint: When using the FINANCIAL worksheet, make your entries of unit sales in thousands of units, and dollar figures in thousands of dollars. That is, to enter 30 million units, type 30000," or to enter indirect costs of $100,000,000, enter"100000. This minimizes the number of zeroes in the spreadsheet and facilitates interpretation. Caution: Add back the zeroes when obtaining results. So if your NPV shows $2,000,000, it really means $2 billion! ASSESSOR is a model that can be used in pret market valuatice of a new product, and was first described by Silk and Urban in 1978 The version of ASSESSOR appearing here is a simplified ons, including only one of the full ASSESSOR submodels. This submodel focuses on projection of market shares for a new brand based on estimates of eness, trial and repeat purchases Trial of a new brand can be induced though advertising er product sampling. To get the state of long-runmarketc, repeat purchase rates must also be calculated using probability of switchout from current brand the new brand, and probability of repurchase of the new brand ASSESSOR projects w e re mate Projected long run market share is simply the product of projected ultimate penetration rate and ultimate peale. **Pape down to continue ASSESSOR MODEL SNO,000K $600,000 D Advertising Distribution Sales Promo Contribution Per Unit Long-Run Trial Probability (F) Prob. of Trying a Received Sample (U) Prob. of Switching to New Brand (Ok) Prob. of Repurchasing New Brand (O ) Projected Ultimate Penetration Projected imate Repeat Projected Long Run Market Share Industry Sales Projection Projected Company Sales Variable Contribution Margin Fixed Costs: Marketing 0.45 25000000 units 7172057 units 55.379,043 $1.800.000 $2.500.000 Total Fixed Costs Total Profit Contribution S4300.000 $1,079,043 Page down to change indiges INDICES FOR ASSESSOR MODEL SETTING THE ADVERTISING RESPONSE FUNCTION Reference Badget: SN00,000 Esponent Minimum Share: Maximum Share: Awareness Prohk 0475 50 SETTING THE DISTRIBUTION RESPONSE FUNCTION Reference Badget: 5600.000 Exponent Maximum Share Expo SETTING THE SALES PROMOTION RESPONSE FUNCTION Reference Budget 5400 DCO Minimum Share: Maximum Share: 0.0 Prob. of Rec Sample (C) ***After adjusting indices up to continue asis PERCEPTOR POSMAP3 POSMAP4 PRODUCT POSITIONING USING THE PERCEPTOR MODEL The PERCEPTOR model r ally developed by Glen Coin 1975. The model is dood to make project of man miel har den positiofend p a didideal pois. Legru market stures are estimating we distances frente dal bondag nalassement s and ability of the w eb of trial and repeat purchase. The model de cimates of market show from ting brand paleo penting a posting map from the input data for casy m onof The PERCEPTOR predhod no odliwe different petitive heav 2 lose-comed -tenstest i. It will also plat androitions and seament del pos t er dowe pot indir speedinte SITUATION ANALYSIS FOUR COMPETITORS IN INDUSTRY CURRENT MARKET SHARE ANALYSIS ATTRIR1 ATTRIR. SIZE OF SEGMENT BRAND SHARE IN SHARE IN IDEAL BRANDS BY SEGMENT YOURBRAND 2014 Sement Sement 10.445 34.535 541 7.95% 50% 2143 29.71% 18.99 1456 BRAND POSITIONS Segnem 20. 0 YOURBRAND Ti an w e wanby **Positing map shown in POSMAN Pepe down and more to do analysis for three p rintr- ways Positioning mapishi POSMAN *** SITUATION ANALYSIS THREE COMPETITORS IN INDUSTRY CURRENT MARKET SHARE ANALYSIS ATTRIRI ATTIR, 1 MIZE OF SEGMENT RP TO MARKET RRAND SHARK IN SEG.2 SHARE IN SEGI MARKET SHARE SEGI IDEALINRANNY SEMENT YOURRAND 46 27,00 BRAND POSITIONS Sirof anon YOURRAND an Inc T by wwwwww sing mapishwe is POSMAP Per to rrent markets and *w ing up shown in POSMAP Papp doe s PERCEPTOR POSMAP3 POSMAP4 POSITIONING MAP PERCEPTOR POSMAP3 POSMAP4 POSITIONING MAP Sheet1 Sheet2 Sheet3 FINANCIAL WORKSHEET they yemeyer Me 32 333 33


