

Answered step by step
Verified Expert Solution
Question
1 Approved Answer
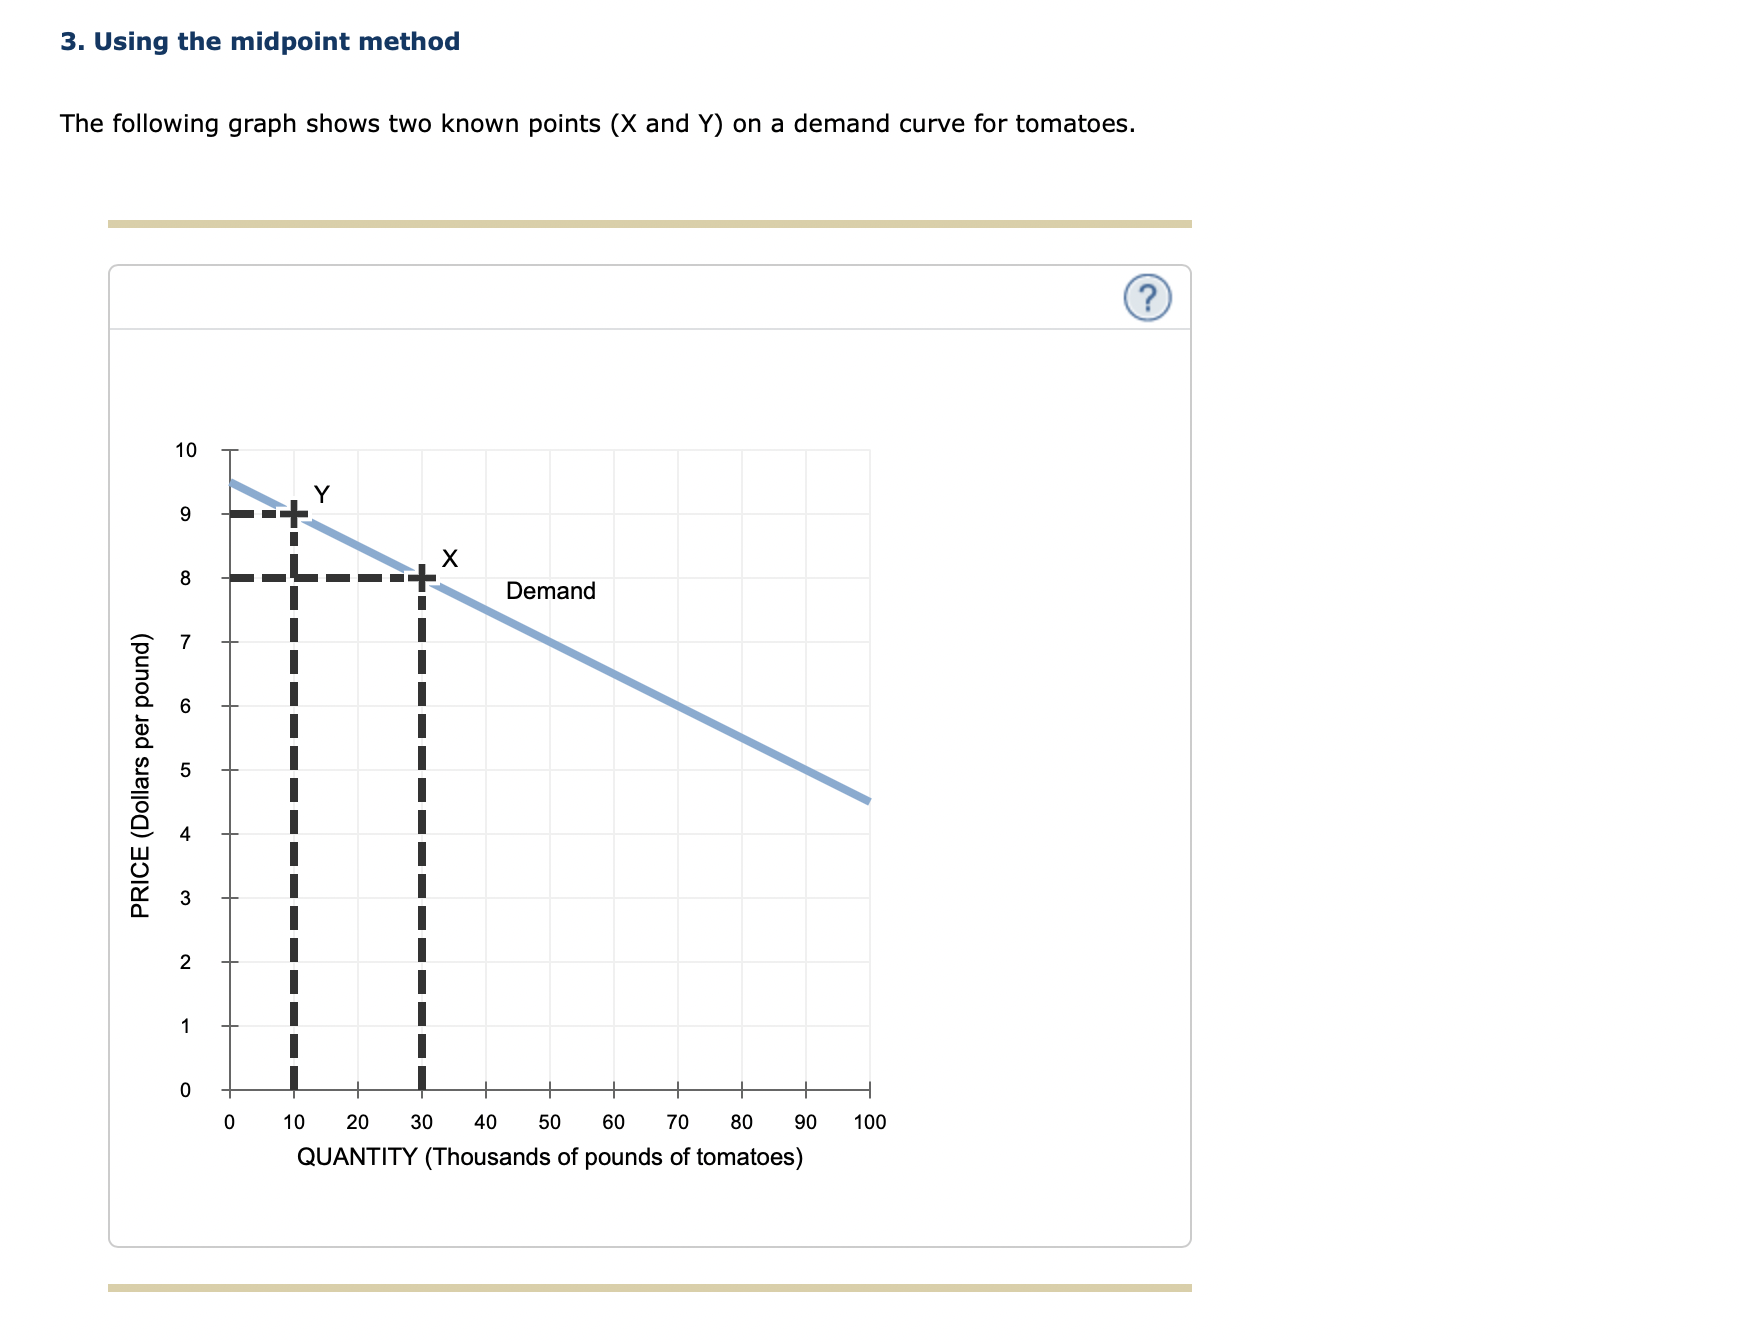
3. Using the midpoint method The following graph shows two known points (X and Y) on a demand curve for tomatoes. 10 Y CO X


Step by Step Solution
There are 3 Steps involved in it
Step: 1

Get Instant Access to Expert-Tailored Solutions
See step-by-step solutions with expert insights and AI powered tools for academic success
Step: 2

Step: 3
Ace Your Homework with AI
Get the answers you need in no time with our AI-driven, step-by-step assistance
Get Started
Global Business Today
Authors: Charles Hill
9th Edition
1259299201, 9781259299209