Answered step by step
Verified Expert Solution
Question
1 Approved Answer
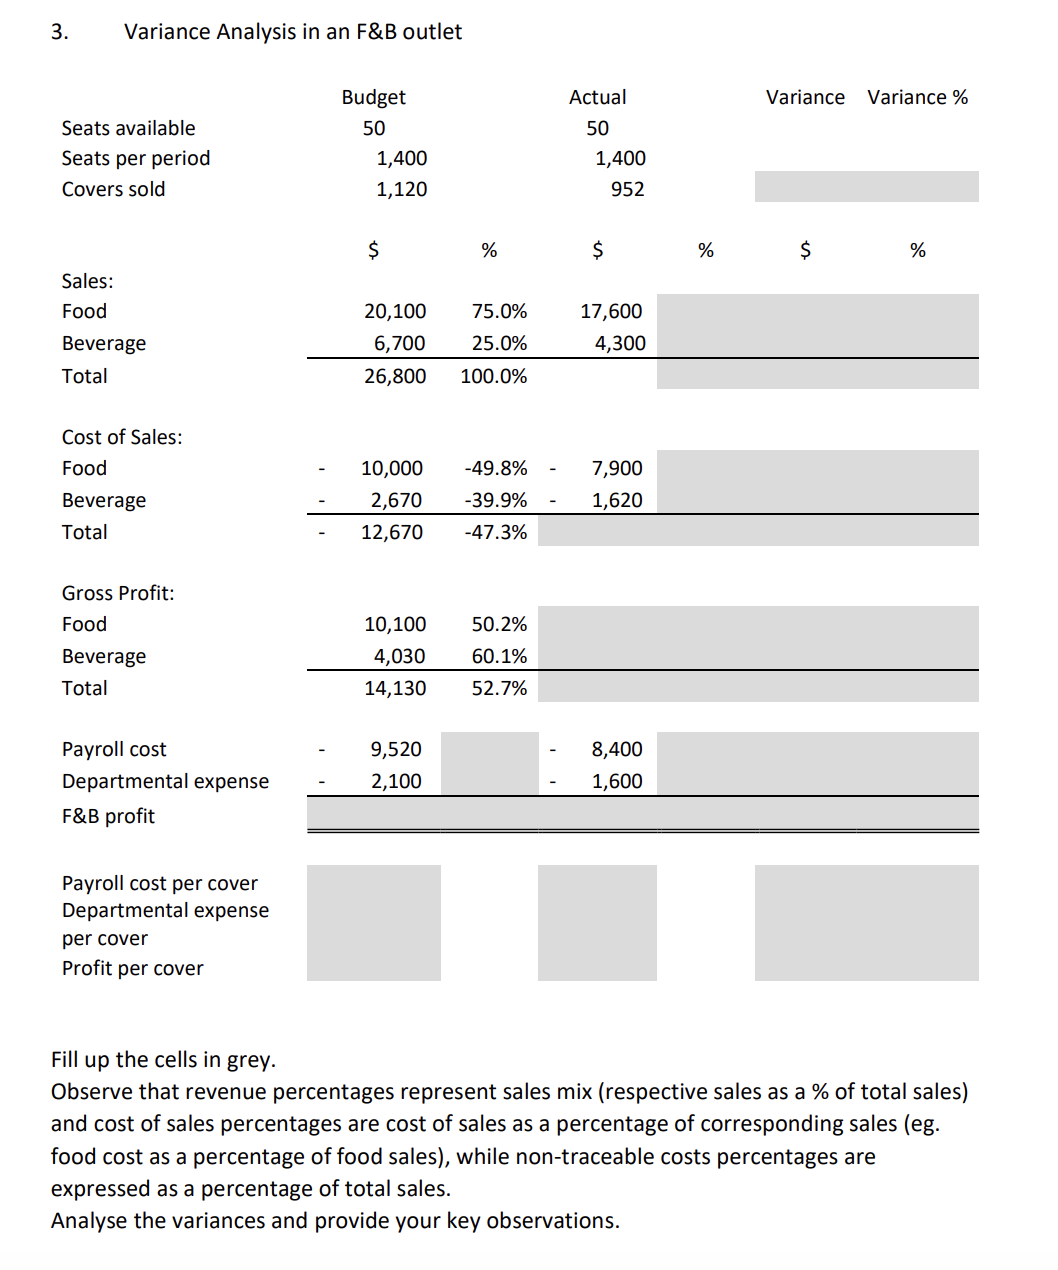
3. Variance Analysis in an F&B outlet Seats available Seats per period Covers sold Sales: Food Beverage Total Cost of Sales: Food Beverage Total

3. Variance Analysis in an F&B outlet Seats available Seats per period Covers sold Sales: Food Beverage Total Cost of Sales: Food Beverage Total Gross Profit: Food Beverage Total Payroll cost Departmental expense F&B profit Payroll cost per cover Departmental expense per cover Profit per cover Budget 50 1,400 1,120 $ 20,100 75.0% 6,700 25.0% 26,800 100.0% % 10,000 -49.8% 2,670 -39.9% 12,670 -47.3% 10,100 4,030 14,130 9,520 2,100 50.2% 60.1% 52.7% Actual 50 1,400 952 $ 17,600 4,300 7,900 1,620 8,400 1,600 % Variance Variance % $ % Fill up the cells in grey. Observe that revenue percentages represent sales mix (respective sales as a % of total sales) and cost of sales percentages are cost of sales as a percentage of corresponding sales (eg. food cost as a percentage of food sales), while non-traceable costs percentages are expressed as a percentage of total sales. Analyse the variances and provide your key observations.
Step by Step Solution
★★★★★
3.55 Rating (148 Votes )
There are 3 Steps involved in it
Step: 1
Solution Seats per period 1400 Covers sold 1120 Variance 1400 1120 280 Variance 28014...
Get Instant Access to Expert-Tailored Solutions
See step-by-step solutions with expert insights and AI powered tools for academic success
Step: 2

Step: 3

Ace Your Homework with AI
Get the answers you need in no time with our AI-driven, step-by-step assistance
Get Started


