Answered step by step
Verified Expert Solution
Question
1 Approved Answer
3. You work at a firm in a competitive market with market price = $250. The firm's cost function is C(q) = 10,000+ q

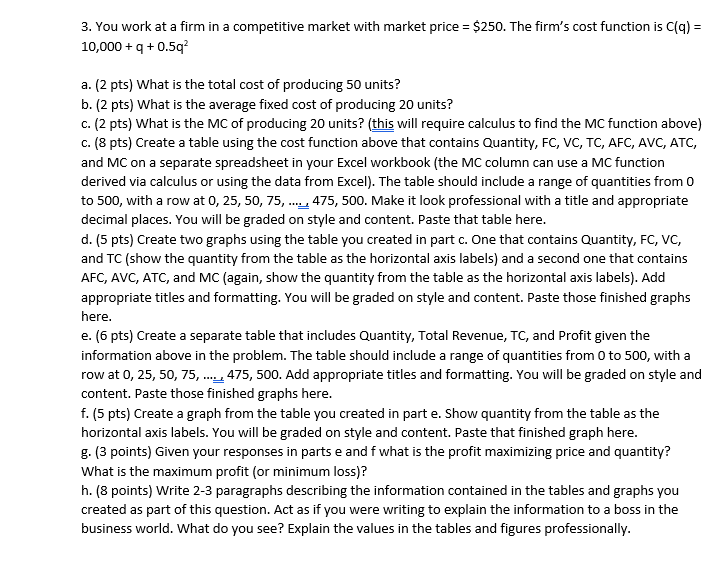
3. You work at a firm in a competitive market with market price = $250. The firm's cost function is C(q) = 10,000+ q + 0.5q a. (2 pts) What is the total cost of producing 50 units? b. (2 pts) What is the average fixed cost of producing 20 units? c. (2 pts) What is the MC of producing 20 units? (this will require calculus to find the MC function above) c. (8 pts) Create a table using the cost function above that contains Quantity, FC, VC, TC, AFC, AVC, ATC, and MC on a separate spreadsheet in your Excel workbook (the MC column can use a MC function derived via calculus or using the data from Excel). The table should include a range of quantities from 0 to 500, with a row at 0, 25, 50, 75, ...., 475,500. Make it look professional with a title and appropriate decimal places. You will be graded on style and content. Paste that table here. d. (5 pts) Create two graphs using the table you created in part c. One that contains Quantity, FC, VC, and TC (show the quantity from the table as the horizontal axis labels) and a second one that contains AFC, AVC, ATC, and MC (again, show the quantity from the table as the horizontal axis labels). Add appropriate titles and formatting. You will be graded on style and content. Paste those finished graphs here. e. (6 pts) Create a separate table that includes Quantity, Total Revenue, TC, and Profit given the information above in the problem. The table should include a range of quantities from 0 to 500, with a row at 0, 25, 50, 75, ..., 475, 500. Add appropriate titles and formatting. You will be graded on style and content. Paste those finished graphs here. f. (5 pts) Create a graph from the table you created in part e. Show quantity from the table as the horizontal axis labels. You will be graded on style and content. Paste that finished graph here. g. (3 points) Given your responses in parts e and f what is the profit maximizing price and quantity? What is the maximum profit (or minimum loss)? h. (8 points) Write 2-3 paragraphs describing the information contained in the tables and graphs you created as part of this question. Act as if you were writing to explain the information to a boss in the business world. What do you see? Explain the values in the tables and figures professionally.
Step by Step Solution
★★★★★
3.42 Rating (149 Votes )
There are 3 Steps involved in it
Step: 1
Sure Lets break it down a Total Cost of Producing 50 Units Were given the cost function Cq 10000 q 0...
Get Instant Access to Expert-Tailored Solutions
See step-by-step solutions with expert insights and AI powered tools for academic success
Step: 2

Step: 3

Ace Your Homework with AI
Get the answers you need in no time with our AI-driven, step-by-step assistance
Get Started


