

Answered step by step
Verified Expert Solution
Question
1 Approved Answer
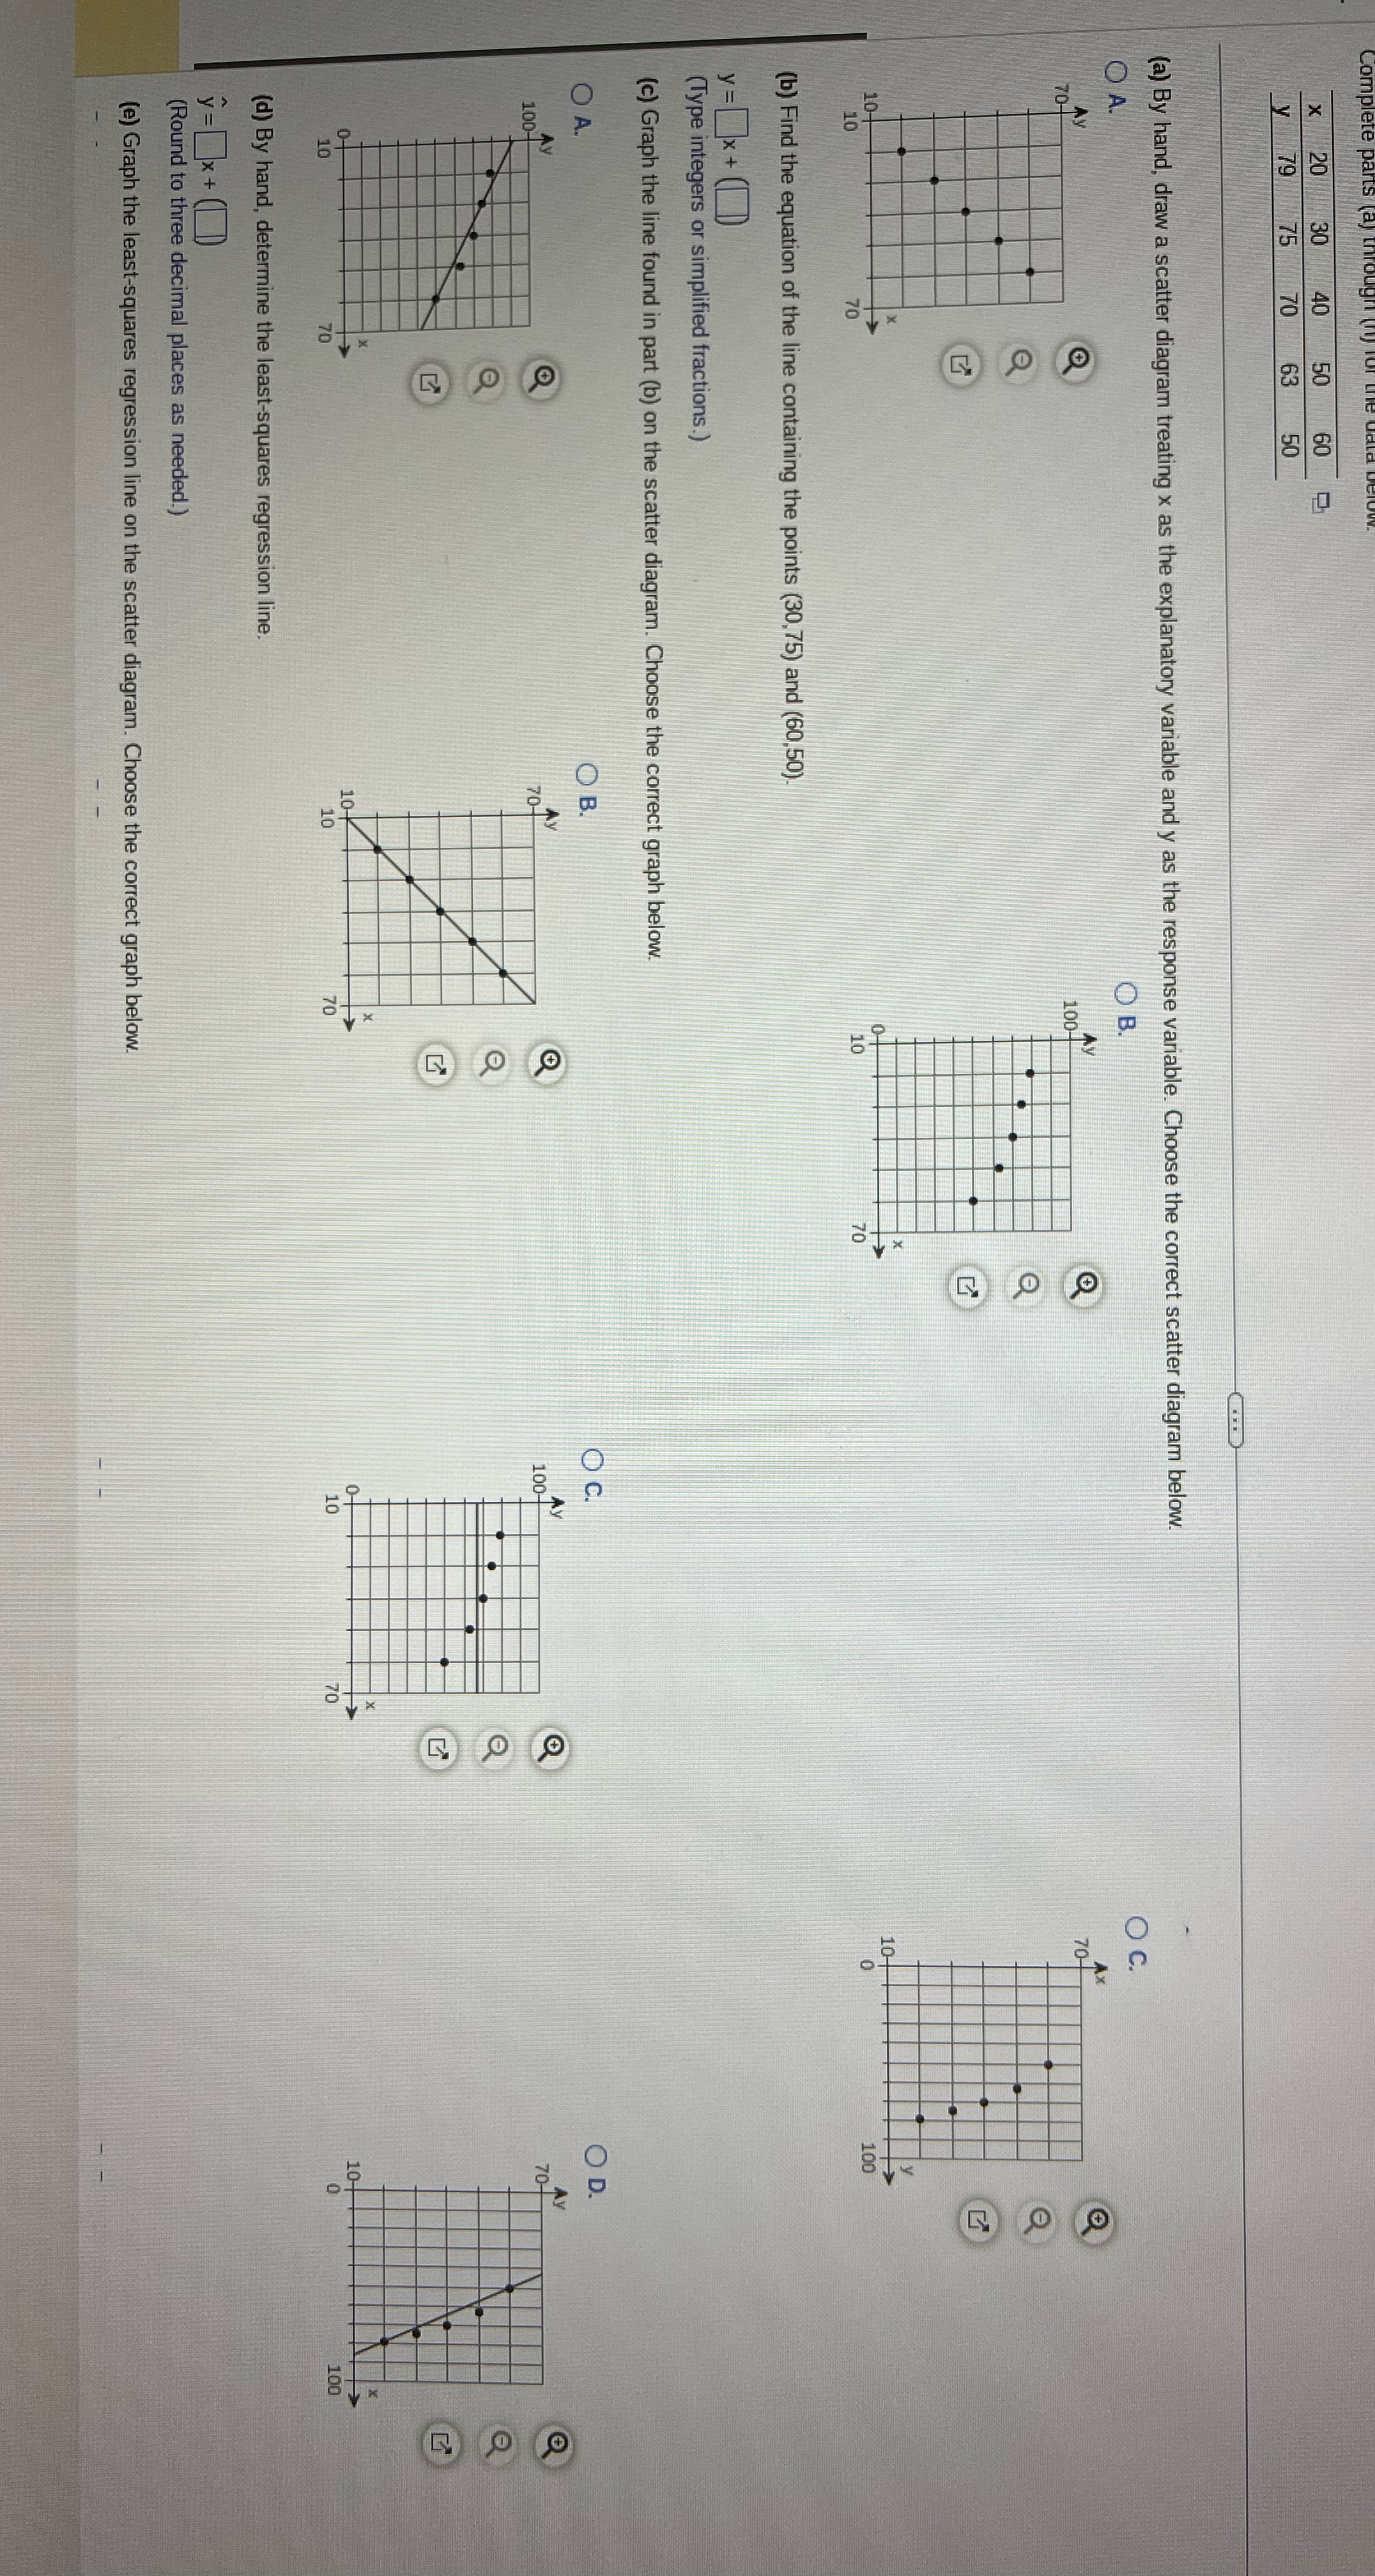
30 40 50 8 9 12 63 (a) By hand, draw a scatter diagram treating x as the explanatory variable and y as the response
Step by Step Solution
There are 3 Steps involved in it
Step: 1

Get Instant Access to Expert-Tailored Solutions
See step-by-step solutions with expert insights and AI powered tools for academic success
Step: 2

Step: 3
Ace Your Homework with AI
Get the answers you need in no time with our AI-driven, step-by-step assistance
Get Started
Elementary & Intermediate Algebra Functions And Authentic Applications (Subscription)
Authors: Jay Lehmann
3rd Edition
0134780264, 9780134780269