

Answered step by step
Verified Expert Solution
Question
1 Approved Answer
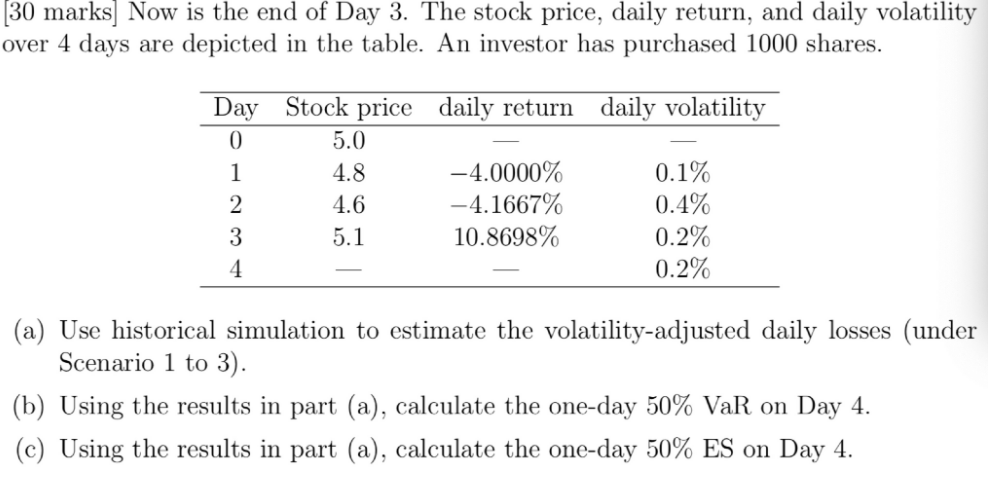
(30 marks] Now is the end of Day 3. The stock price, daily return, and daily volatility over 4 days are depicted in the table.
Step by Step Solution
There are 3 Steps involved in it
Step: 1

Get Instant Access to Expert-Tailored Solutions
See step-by-step solutions with expert insights and AI powered tools for academic success
Step: 2

Step: 3
Ace Your Homework with AI
Get the answers you need in no time with our AI-driven, step-by-step assistance
Get Started
Advances In Entrepreneurial Finance
Authors: Rassoul Yazdipour
2011th Edition
148998190X, 978-1489981905