Answered step by step
Verified Expert Solution
Question
1 Approved Answer
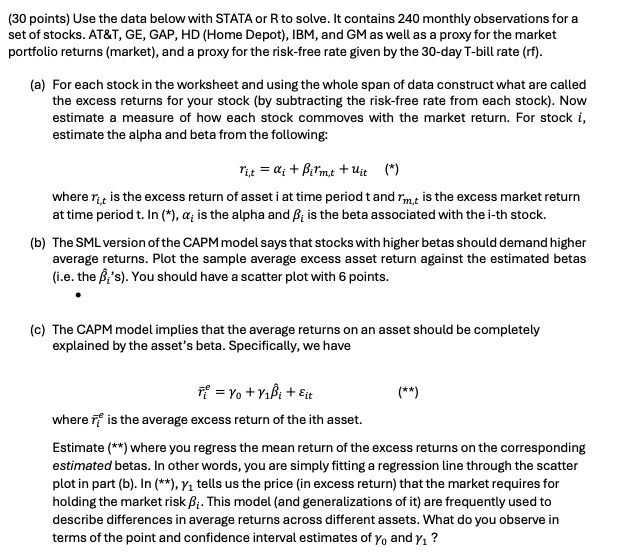
(30 points) Use the data below with STATA or R to solve. It contains 240 monthly observations for a set of stocks. AT&T, GE,

(30 points) Use the data below with STATA or R to solve. It contains 240 monthly observations for a set of stocks. AT&T, GE, GAP, HD (Home Depot), IBM, and GM as well as a proxy for the market portfolio returns (market), and a proxy for the risk-free rate given by the 30-day T-bill rate (rf). (a) For each stock in the worksheet and using the whole span of data construct what are called the excess returns for your stock (by subtracting the risk-free rate from each stock). Now estimate a measure of how each stock commoves with the market return. For stock i, estimate the alpha and beta from the following: Tit = ai +Birmt + Uit (*) where it is the excess return of asset i at time period t and rmt is the excess market return at time period t. In (*), a is the alpha and ; is the beta associated with the i-th stock. (b) The SML version of the CAPM model says that stocks with higher betas should demand higher average returns. Plot the sample average excess asset return against the estimated betas (i.e. the B's). You should have a scatter plot with 6 points. (c) The CAPM model implies that the average returns on an asset should be completely explained by the asset's beta. Specifically, we have T = Yo + Yi + Eit where is the average excess return of the ith asset. (**) Estimate (**) where you regress the mean return of the excess returns on the corresponding estimated betas. In other words, you are simply fitting a regression line through the scatter plot in part (b). In (**), Y tells us the price (in excess return) that the market requires for holding the market risk . This model (and generalizations of it) are frequently used to describe differences in average returns across different assets. What do you observe in terms of the point and confidence interval estimates of yo and y ?
Step by Step Solution
There are 3 Steps involved in it
Step: 1

Get Instant Access to Expert-Tailored Solutions
See step-by-step solutions with expert insights and AI powered tools for academic success
Step: 2

Step: 3

Ace Your Homework with AI
Get the answers you need in no time with our AI-driven, step-by-step assistance
Get Started


