Answered step by step
Verified Expert Solution
Question
1 Approved Answer
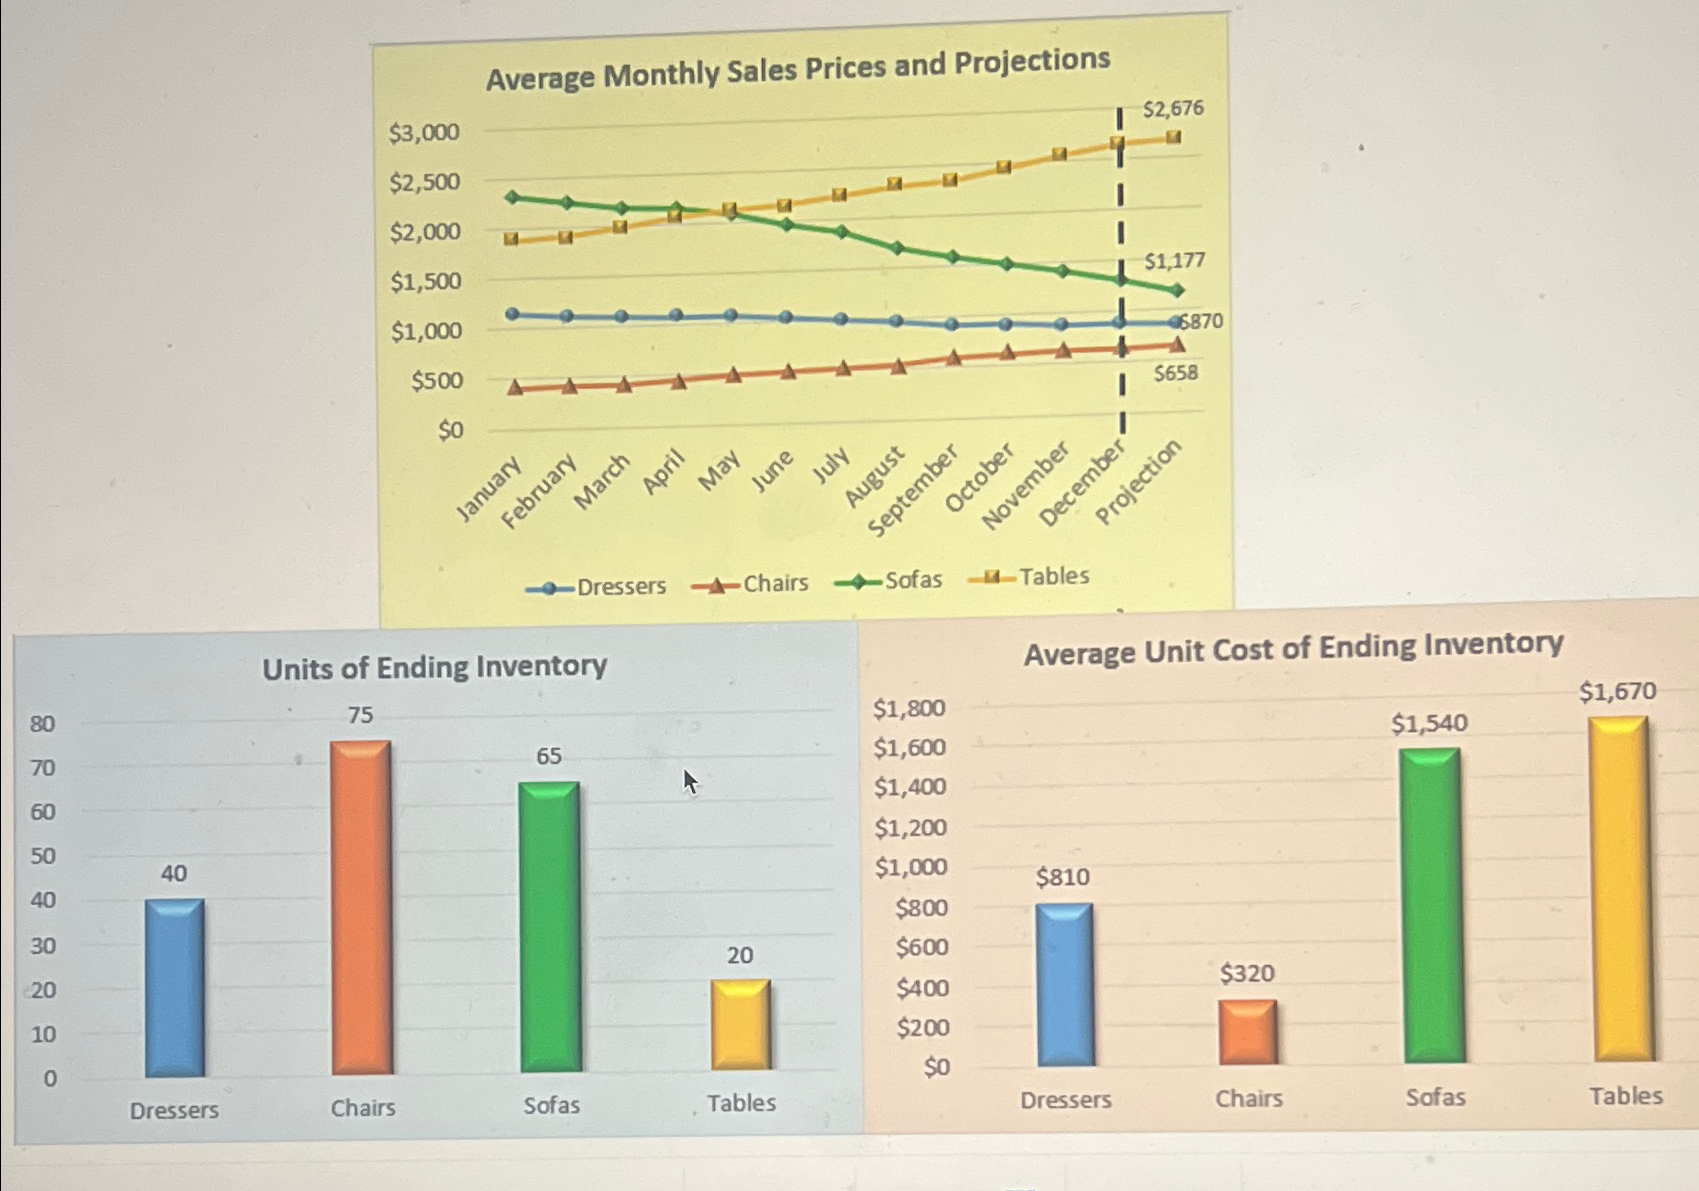
$3,000 $2,500 $2,000 $1,500 $1,000 $500 $0 January Average Monthly Sales Prices and Projections February March $2,676 $1,177 6870 $658 April May June July

$3,000 $2,500 $2,000 $1,500 $1,000 $500 $0 January Average Monthly Sales Prices and Projections February March $2,676 $1,177 6870 $658 April May June July August September Dressers -Chairs Sofas -Tables October November December Projection Units of Ending Inventory Average Unit Cost of Ending Inventory 30 20 10 Ro 80 70 60 50 40 40 75 $1,800 $1,670 $1,540 65 $1,600 $1,400 $1,200 $1,000 $810 $800 20 $600 $320 $400 $200 0 $0 Dressers Chairs Sofas Tables Dressers Chairs Sofas Tables
Step by Step Solution
There are 3 Steps involved in it
Step: 1

Get Instant Access to Expert-Tailored Solutions
See step-by-step solutions with expert insights and AI powered tools for academic success
Step: 2

Step: 3

Ace Your Homework with AI
Get the answers you need in no time with our AI-driven, step-by-step assistance
Get Started


