Answered step by step
Verified Expert Solution
Question
1 Approved Answer
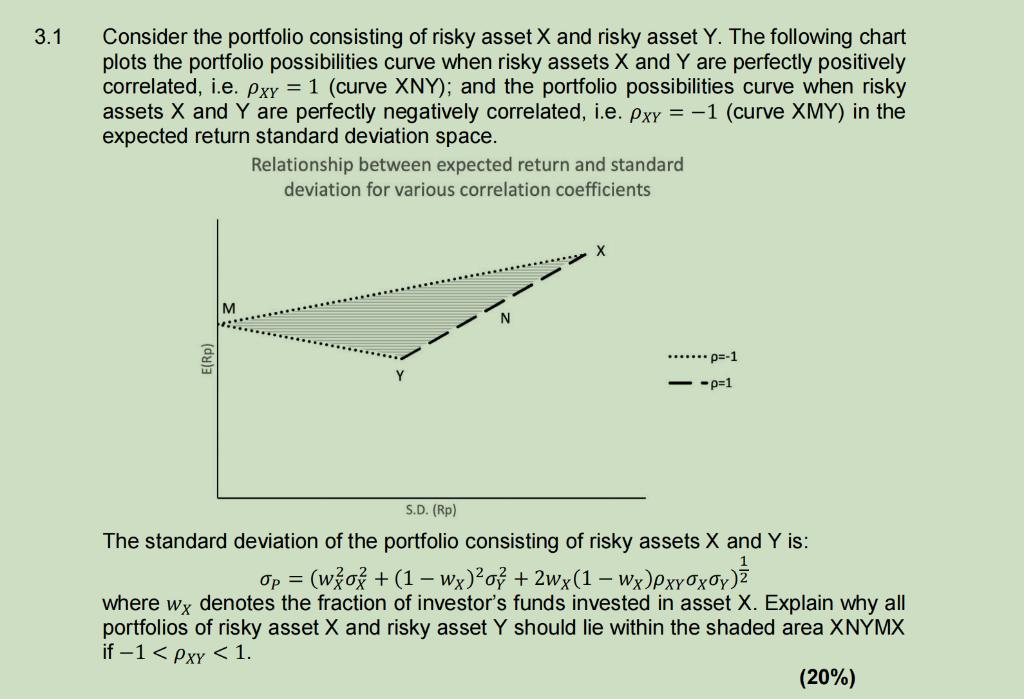
3.1 Consider the portfolio consisting of risky asset X and risky asset Y. The following chart plots the portfolio possibilities curve when risky assets

3.1 Consider the portfolio consisting of risky asset X and risky asset Y. The following chart plots the portfolio possibilities curve when risky assets X and Y are perfectly positively correlated, i.e. Pxy = 1 (curve XNY); and the portfolio possibilities curve when risky assets X and Y are perfectly negatively correlated, i.e. pxy = -1 (curve XMY) in the expected return standard deviation space. Relationship between expected return and standard deviation for various correlation coefficients M X p=-1 --p=1 S.D. (Rp) The standard deviation of the portfolio consisting of risky assets X and Y is: 1 Op = (wo + (1 - wx)o? + 2wx (1 - Wx)Pxyxoy) where wx denotes the fraction of investor's funds invested in asset X. Explain why all portfolios of risky asset X and risky asset Y should lie within the shaded area XNYMX if -1 < Pxy < 1. (20%)
Step by Step Solution
★★★★★
3.42 Rating (149 Votes )
There are 3 Steps involved in it
Step: 1

Get Instant Access to Expert-Tailored Solutions
See step-by-step solutions with expert insights and AI powered tools for academic success
Step: 2

Step: 3

Ace Your Homework with AI
Get the answers you need in no time with our AI-driven, step-by-step assistance
Get Started


