Answered step by step
Verified Expert Solution
Question
1 Approved Answer
3.1.a Numerical aperture of different objectives Calculate the numerical aperture of the four objectives listed in the table below (Note: The refractive index of

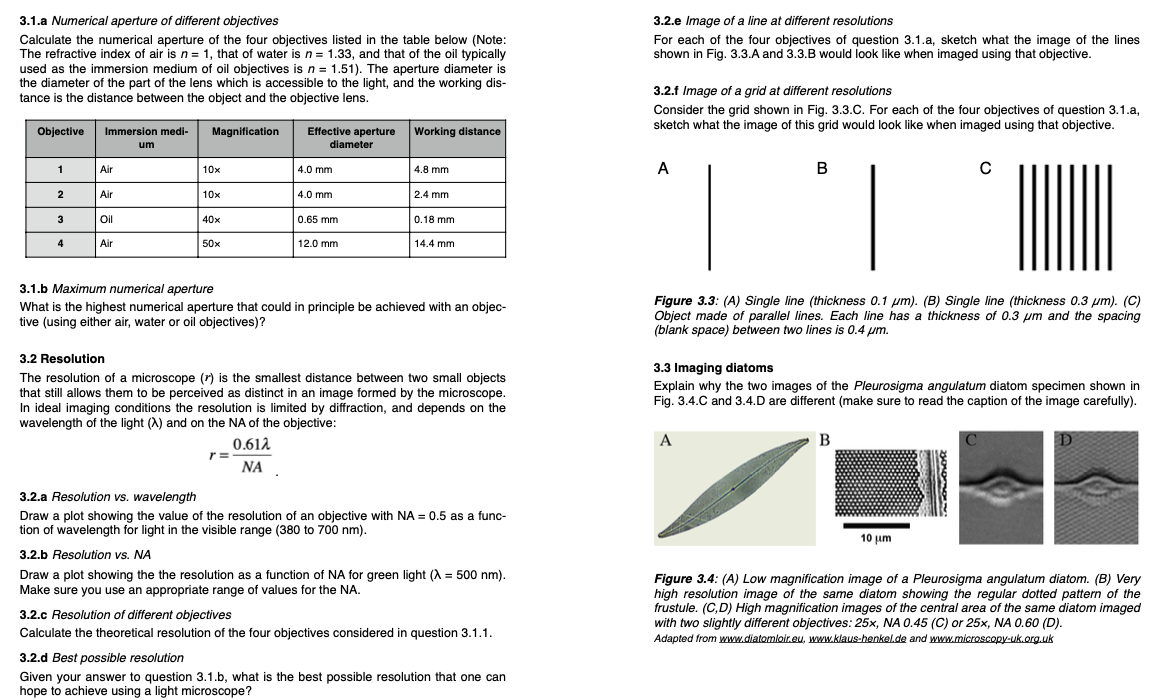
3.1.a Numerical aperture of different objectives Calculate the numerical aperture of the four objectives listed in the table below (Note: The refractive index of air is n = 1, that of water is n = 1.33, and that of the oil typically used as the immersion medium of oil objectives is n = 1.51). The aperture diameter is the diameter of the part of the lens which is accessible to the light, and the working dis- tance is the distance between the object and the objective lens. Effective aperture Working distance diameter Objective Immersion medi- Magnification um 1 Air 10x 4.0 mm 4.8 mm 2 Air 10x 4.0 mm 2.4 mm 3 Oil 40x 0.65 mm 0.18 mm 4 Air 50x 12.0 mm 14.4 mm 3.1.b Maximum numerical aperture What is the highest numerical aperture that could in principle be achieved with an objec- tive (using either air, water or oil objectives)? 3.2 Resolution The resolution of a microscope (r) is the smallest distance between two small objects that still allows them to be perceived as distinct in an image formed by the microscope. In ideal imaging conditions the resolution is limited by diffraction, and depends on the wavelength of the light (X) and on the NA of the objective: 3.2.a Resolution vs. wavelength r= 0.612 Draw a plot showing the value of the resolution of an objective with NA = 0.5 as a func- tion of wavelength for light in the visible range (380 to 700 nm). 3.2.b Resolution vs. NA Draw a plot showing the the resolution as a function of NA for green light (X = 500 nm). Make sure you use an appropriate range of values for the NA. 3.2.c Resolution of different objectives Calculate the theoretical resolution of the four objectives considered in question 3.1.1. 3.2.d Best possible resolution Given your answer to question 3.1.b, what is the best possible resolution that one can hope to achieve using a light microscope? 3.2.e Image of a line at different resolutions For each of the four objectives of question 3.1.a, sketch what the image of the lines shown in Fig. 3.3.A and 3.3.B would look like when imaged using that objective. 3.2.f Image of a grid at different resolutions Consider the grid shown in Fig. 3.3.C. For each of the four objectives of question 3.1.a, sketch what the image of this grid would look like when imaged using that objective. A C Figure 3.3: (A) Single line (thickness 0.1 m). (B) Single line (thickness 0.3 m). (C) Object made of parallel lines. Each line has a thickness of 0.3 m and the spacing (blank space) between two lines is 0.4 m. 3.3 Imaging diatoms Explain why the two images of the Pleurosigma angulatum diatom specimen shown in Fig. 3.4.C and 3.4.D are different (make sure to read the caption of the image carefully). A B 10 m D Figure 3.4: (A) Low magnification image of a Pleurosigma angulatum diatom. (B) Very high resolution image of the same diatom showing the regular dotted pattern of the frustule. (C,D) High magnification images of the central area of the same diatom imaged with two slightly different objectives: 25x, NA 0.45 (C) or 25x, NA 0.60 (D). Adapted from www.diatomloir.eu, www.klaus-henkel.de and www.microscopy-uk.org.uk
Step by Step Solution
There are 3 Steps involved in it
Step: 1

Get Instant Access to Expert-Tailored Solutions
See step-by-step solutions with expert insights and AI powered tools for academic success
Step: 2

Step: 3

Ace Your Homework with AI
Get the answers you need in no time with our AI-driven, step-by-step assistance
Get Started


