

Answered step by step
Verified Expert Solution
Question
1 Approved Answer
3(3016) QUESTION 3: Trip generation in a traffic zone is predicted based on the household size and vehicle ownership of sample households selected for the
3(3016) 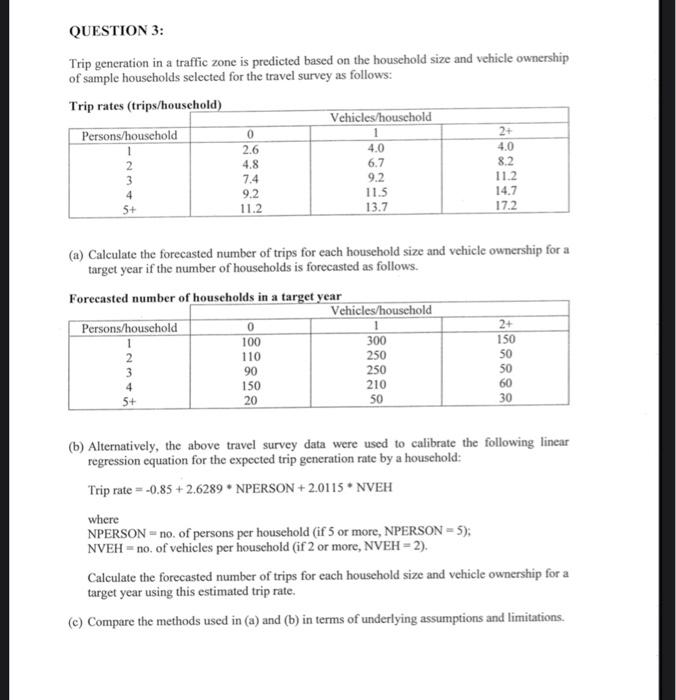
QUESTION 3: Trip generation in a traffic zone is predicted based on the household size and vehicle ownership of sample households selected for the travel survey as follows: Trip rates (trips/household) Vehicles/household Persons/household 0 2+ 2.6 4.0 4.0 2 4.8 6.7 8.2 3 7.4 9.2 11.2 9.2 11.5 14.7 5+ 11.2 13.7 17.2 4 (a) Calculate the forecasted number of trips for each household size and vehicle ownership for a target year if the number of households is forecasted as follows. Forecasted number of households in a target year Vehicles/household Persons/household 0 1 2+ 1 100 300 150 2 110 250 SO 3 90 250 50 150 210 60 5+ 20 50 30 4 (b) Alternatively, the above travel survey data were used to calibrate the following linear regression equation for the expected trip generation rate by a household: Trip rate -0.85 +2.6289. NPERSON +2.0115 *NVEH where NPERSON - no. of persons per household (if 5 or more, NPERSON - 5); NVEH - no. of vehicles per household (if 2 or more, NVEH = 2). Calculate the forecasted number of trips for each household size and vehicle ownership for a target year using this estimated trip rate. (c) Compare the methods used in (a) and (b) in terms of underlying assumptions and limitations QUESTION 3: Trip generation in a traffic zone is predicted based on the household size and vehicle ownership of sample households selected for the travel survey as follows: Trip rates (trips/household) Vehicles/household Persons/household 0 2+ 2.6 4.0 4.0 2 4.8 6.7 8.2 3 7.4 9.2 11.2 9.2 11.5 14.7 5+ 11.2 13.7 17.2 4 (a) Calculate the forecasted number of trips for each household size and vehicle ownership for a target year if the number of households is forecasted as follows. Forecasted number of households in a target year Vehicles/household Persons/household 0 1 2+ 1 100 300 150 2 110 250 SO 3 90 250 50 150 210 60 5+ 20 50 30 4 (b) Alternatively, the above travel survey data were used to calibrate the following linear regression equation for the expected trip generation rate by a household: Trip rate -0.85 +2.6289. NPERSON +2.0115 *NVEH where NPERSON - no. of persons per household (if 5 or more, NPERSON - 5); NVEH - no. of vehicles per household (if 2 or more, NVEH = 2). Calculate the forecasted number of trips for each household size and vehicle ownership for a target year using this estimated trip rate. (c) Compare the methods used in (a) and (b) in terms of underlying assumptions and limitations Step by Step Solution
There are 3 Steps involved in it
Step: 1

Get Instant Access to Expert-Tailored Solutions
See step-by-step solutions with expert insights and AI powered tools for academic success
Step: 2

Step: 3
Ace Your Homework with AI
Get the answers you need in no time with our AI-driven, step-by-step assistance
Get Started
Labour Finance And Inequality
Authors: Suzanne J. Konzelmann, Simon Deakin, Marc Fovargue-Davies, Frank Wilkinson
1st Edition
1138919721, 978-1138919723