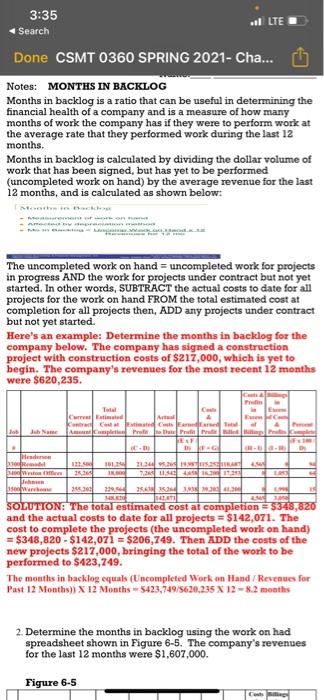
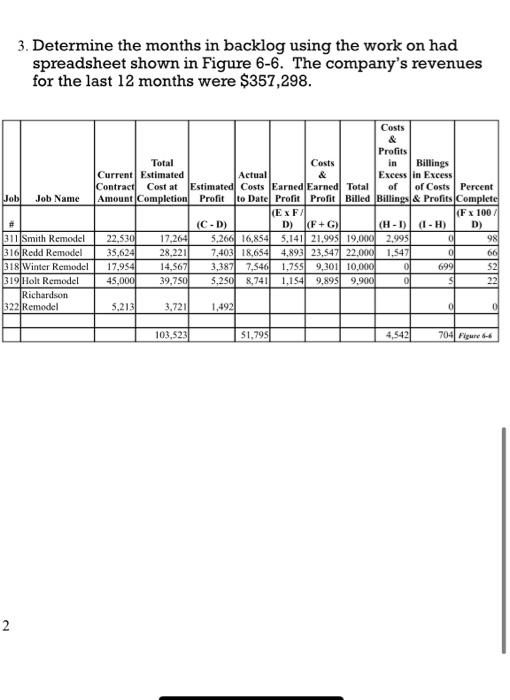
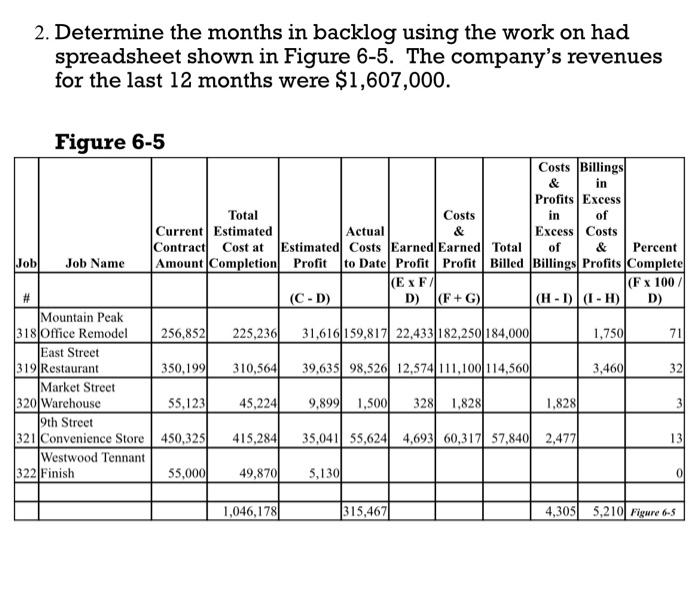
3:35 vl | Search Done CSMT 0360 SPRING 2021- Cha... Notes: MONTHS IN BACKLOG Months in backlog is a ratio that can be useful in determining the financial health of a company and is a measure of how many months of work the company has if they were to perform work at the average rate that they performed work during the last 12 months. Months in backlog is calculated by dividing the dollar volume of work that has been signed, but has yet to be performed (uncompleted work on hand) by the average revenue for the last 12 months, and is calculated as shown below: The uncompleted work on hand = uncompleted work for projects in progress AND the work for projects under contract but not yet started. In other words, SUBTRACT the actual costs to date for all projects for the work on hand FROM the total estimated cost at completion for all projects then, ADD any projects under contract but not yet started. Here's an example: Determine the months in backlog for the company below. The company has signed a construction project with construction costs of $217,000, which is yet to begin. The company's revenues for the most recent 12 months were $620,235. C C www Jab Name Accepted the traditi 100 15 Theses 101 102 263 2013 23.44 1 SOLUTION: The total estimated cost at completion = $348,820 and the actual costs to date for all projects = $142,071. The cost to complete the projects (the uncompleted work on hand) = $348,820 - $142,071 = $206,749. Then ADD the costs of the new projects $217,000, bringing the total of the work to be performed to $423,749. The months in backlog equals (Uncompleted Work on Hand / Revenues for Past 12 Months)) X 12 Months - 5423,749/5620,235 X 12 -8.2 months 2. Determine the months in backlog using the work on had spreadsheet shown in Figure 6-5. The company's revenues for the last 12 months were $1,607,000. Figure 6-5 3. Determine the months in backlog using the work on had spreadsheet shown in Figure 6-6. The company's revenues for the last 12 months were $357,298. Job Job Name Costs & Profits Total Costs in Billings Current Estimated Actual Excess in Excess Contract Cost at Estimated Costs Earned Earned Total of of Costs Percent Amount Completion Profit to Date Profit Profit Billed Billings & Profits Complete (EXF/ (F x 100 (C-D) D) (F+G) (H-1 (1-1) D) 22,530 17.264 5.266 16,854 5.141 21,995 19,000 2.995 0 98 35,624 28,221 7,403 18,654 4,893 23.547 22,000 1.547 0 66 17,9541 14,567 3,387 7,546 1.755 9,30110,000 0 699 52 45,000 39,750 5.250 8,741 1.1549,895 9.900 0 S 22 # 311 Smith Remodel 316 Redd Remodel 318 Winter Remodel 319 Holt Remodel Richardson 322 Remodel 5,2131 3,721 1,492 0 103,523 51,795 4,542 704 Figure 66 2 2 2. Determine the months in backlog using the work on had spreadsheet shown in Figure 6-5. The company's revenues for the last 12 months were $1,607,000. Figure 6-5 Costs Billings & in Profits Excess Total Costs in of Current Estimated Actual Excess Costs Contract Cost at Estimated Costs Earned Earned Total of & Percent Job Job Name Amount Completion Profit to Date Profit Profit Billed Billings Profits Complete (EXF (F x 100/ # (C-D) D) (F+G) (H-1) (I-H) D) Mountain Peak 318 Office Remodel 256,852 225,236 31,616 159,817 22,433 182,250 184,000 1,750 71 East Street 319 Restaurant 350,1991 310,564 39,635 98,526 12,574111,100 114,560 3,4601 321 Market Street 320 Warehouse 55,1231 45,224 9,899 1,5001 328 1.8281 1.828) 19th Street |321 Convenience Store 450,325 415,284 35,041| 55,624 4,693 60,317 57,840 2,477 131 Westwood Tennant 322 Finish 55,000 49,8701 5,1300 0 1,046,178 |315,467 4,3055,210 Figure 6-5 3:35 vl | Search Done CSMT 0360 SPRING 2021- Cha... Notes: MONTHS IN BACKLOG Months in backlog is a ratio that can be useful in determining the financial health of a company and is a measure of how many months of work the company has if they were to perform work at the average rate that they performed work during the last 12 months. Months in backlog is calculated by dividing the dollar volume of work that has been signed, but has yet to be performed (uncompleted work on hand) by the average revenue for the last 12 months, and is calculated as shown below: The uncompleted work on hand = uncompleted work for projects in progress AND the work for projects under contract but not yet started. In other words, SUBTRACT the actual costs to date for all projects for the work on hand FROM the total estimated cost at completion for all projects then, ADD any projects under contract but not yet started. Here's an example: Determine the months in backlog for the company below. The company has signed a construction project with construction costs of $217,000, which is yet to begin. The company's revenues for the most recent 12 months were $620,235. C C www Jab Name Accepted the traditi 100 15 Theses 101 102 263 2013 23.44 1 SOLUTION: The total estimated cost at completion = $348,820 and the actual costs to date for all projects = $142,071. The cost to complete the projects (the uncompleted work on hand) = $348,820 - $142,071 = $206,749. Then ADD the costs of the new projects $217,000, bringing the total of the work to be performed to $423,749. The months in backlog equals (Uncompleted Work on Hand / Revenues for Past 12 Months)) X 12 Months - 5423,749/5620,235 X 12 -8.2 months 2. Determine the months in backlog using the work on had spreadsheet shown in Figure 6-5. The company's revenues for the last 12 months were $1,607,000. Figure 6-5 3. Determine the months in backlog using the work on had spreadsheet shown in Figure 6-6. The company's revenues for the last 12 months were $357,298. Job Job Name Costs & Profits Total Costs in Billings Current Estimated Actual Excess in Excess Contract Cost at Estimated Costs Earned Earned Total of of Costs Percent Amount Completion Profit to Date Profit Profit Billed Billings & Profits Complete (EXF/ (F x 100 (C-D) D) (F+G) (H-1 (1-1) D) 22,530 17.264 5.266 16,854 5.141 21,995 19,000 2.995 0 98 35,624 28,221 7,403 18,654 4,893 23.547 22,000 1.547 0 66 17,9541 14,567 3,387 7,546 1.755 9,30110,000 0 699 52 45,000 39,750 5.250 8,741 1.1549,895 9.900 0 S 22 # 311 Smith Remodel 316 Redd Remodel 318 Winter Remodel 319 Holt Remodel Richardson 322 Remodel 5,2131 3,721 1,492 0 103,523 51,795 4,542 704 Figure 66 2 2 2. Determine the months in backlog using the work on had spreadsheet shown in Figure 6-5. The company's revenues for the last 12 months were $1,607,000. Figure 6-5 Costs Billings & in Profits Excess Total Costs in of Current Estimated Actual Excess Costs Contract Cost at Estimated Costs Earned Earned Total of & Percent Job Job Name Amount Completion Profit to Date Profit Profit Billed Billings Profits Complete (EXF (F x 100/ # (C-D) D) (F+G) (H-1) (I-H) D) Mountain Peak 318 Office Remodel 256,852 225,236 31,616 159,817 22,433 182,250 184,000 1,750 71 East Street 319 Restaurant 350,1991 310,564 39,635 98,526 12,574111,100 114,560 3,4601 321 Market Street 320 Warehouse 55,1231 45,224 9,899 1,5001 328 1.8281 1.828) 19th Street |321 Convenience Store 450,325 415,284 35,041| 55,624 4,693 60,317 57,840 2,477 131 Westwood Tennant 322 Finish 55,000 49,8701 5,1300 0 1,046,178 |315,467 4,3055,210 Figure 6-5


