## 3.4 [2 pts] Now apply your function to a chi-square distribution with 1 dof. use B=500,1000 bootstrap samples, and set your arguments to compute
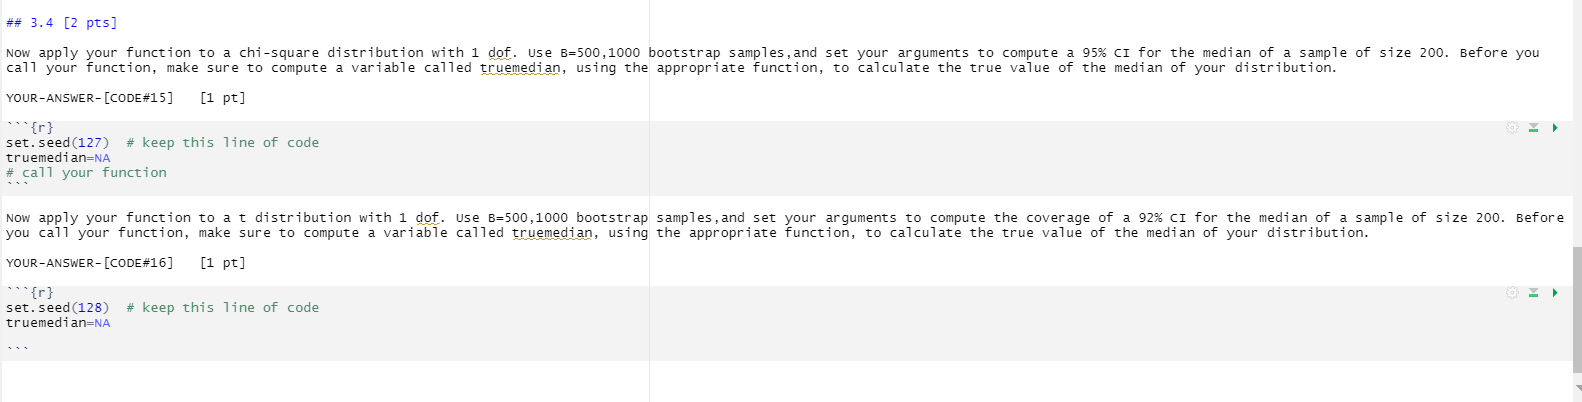
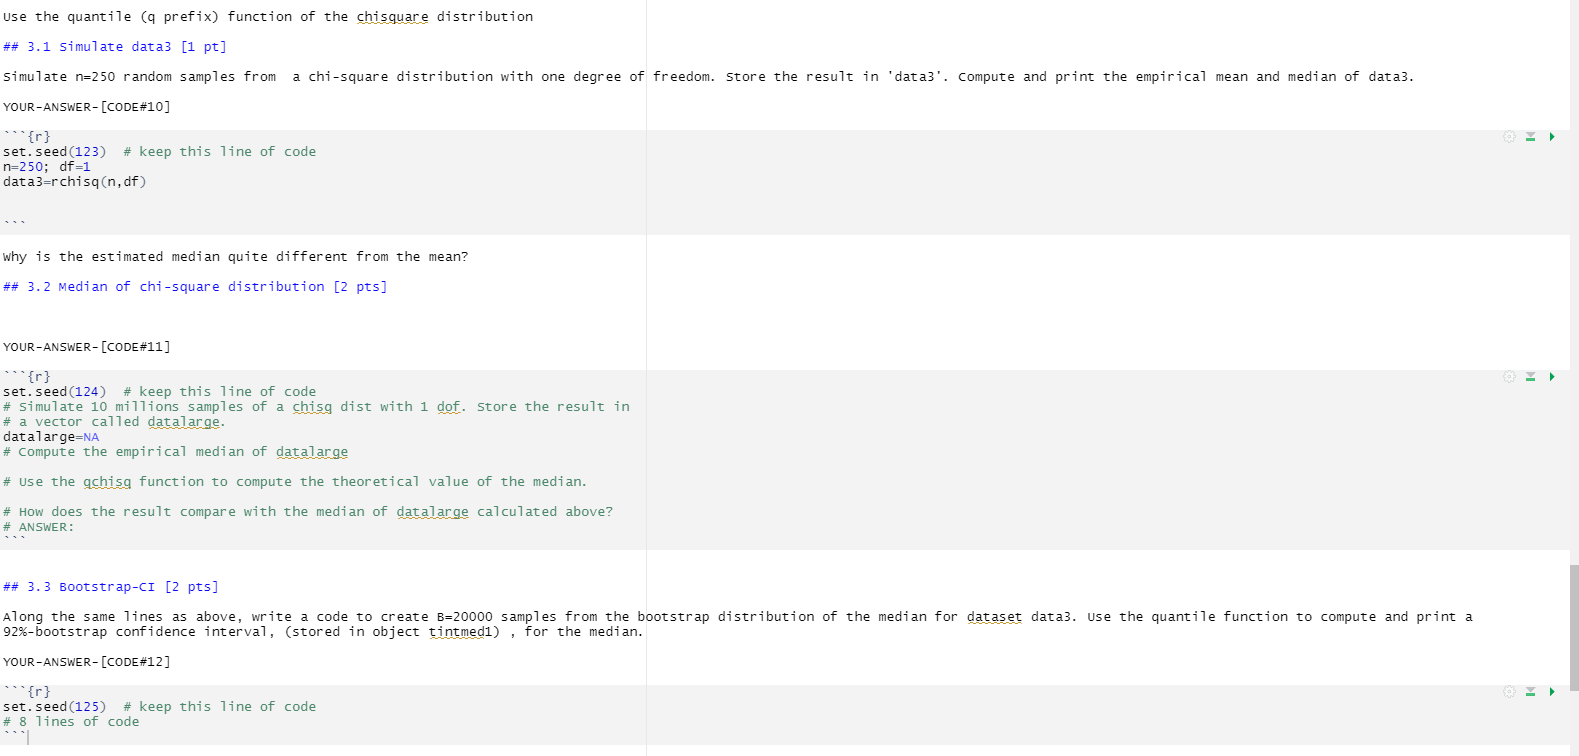
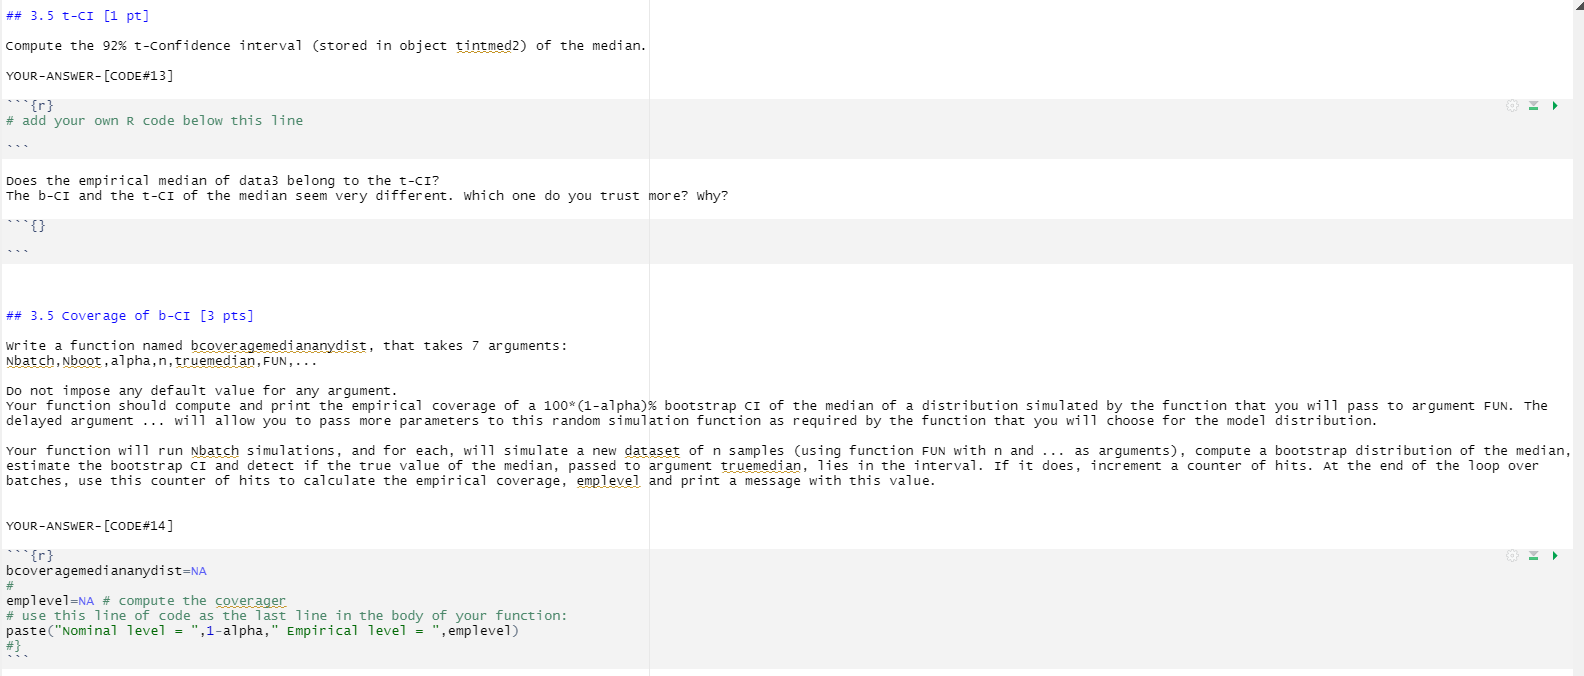
## 3.4 [2 pts] Now apply your function to a chi-square distribution with 1 dof. use B=500,1000 bootstrap samples, and set your arguments to compute a 95% CI for the median of a sample of size 200. Before you call your function, make sure to compute a variable called truemedian, using the appropriate function, to calculate the true value of the median of your distribution. YOUR-ANSWER- [CODE#15] [1 pt] "{r} set. seed (127) # keep this line of code truemedian=NA # call your function Now apply your function to a t distribution with 1 dof. use B=500,1000 bootstrap samples, and set your arguments to compute the coverage of a 92% CI for the median of a sample of size 200. Before you call your function, make sure to compute a variable called truemedian, using the appropriate function, to calculate the true value of the median of your distribution. YOUR-ANSWER- [CODE#16] [1 pt] "{r } set. seed (128) # keep this line of code truemedian=NAuse the quantile (q prefix) function of the chisquare distribution ## 3.1 Simulate data3 [1 pt] Simulate n=250 random samples from a chi-square distribution with one degree of freedom. Store the result in 'data3'. compute and print the empirical mean and median of data3. YOUR-ANSWER- [CODE#10] "{r } set. seed (123) # keep this line of code n=250; df=1 data3=rchisq(n, df) why is the estimated median quite different from the mean? ## 3. 2 Median of chi-square distribution [2 pts] YOUR-ANSWER- [CODE#11 ] "{r } set. seed (124) # keep this line of code # Simulate 10 millions samples of a chisg dist with 1 dof. Store the result in # a vector called datalarge. datalarge=NA # Compute the empirical median of datalarge # use the qchisq function to compute the theoretical value of the median. # How does the result compare with the median of datalarge calculated above? # ANSWER: ## 3.3 Bootstrap-CI [2 pts] Along the same lines as above, write a code to create B=20000 samples from the bootstrap distribution of the median for dataset data3. use the quantile function to compute and print a 92%-bootstrap confidence interval, (stored in object tintmedi) , for the median. YOUR-ANSWER- [CODE#12 ] "{r} set. seed (125) # keep this line of code # 8 lines of code## 3.5 t-CI [1 pt] Compute the 92% t-confidence interval (stored in object tintmed2) of the median. YOUR-ANSWER- [CODE#13 ] "{r} # add your own R code below this line Does the empirical median of data3 belong to the t-CI? The b-CI and the t-CI of the median seem very different. which one do you trust more? why? {} ## 3. 5 coverage of b-CI [3 pts] write a function named bcoveragemediananydist, that takes 7 arguments: Nbatch, Nboot , alpha, n, truemedian, FUN, . . . Do not impose any default value for any argument. Your function should compute and print the empirical coverage of a 100*(1-alpha)% bootstrap CI of the median of a distribution simulated by the function that you will pass to argument FUN. The delayed argument . . . will allow you to pass more parameters to this random simulation function as required by the function that you will choose for the model distribution. Your function will run Nbatch simulations, and for each, will simulate a new dataset of n samples (using function FUN with n and . . . as arguments), compute a bootstrap distribution of the median, estimate the bootstrap CI and detect if the true value of the median, passed to argument truemedian, lies in the interval. If it does, increment a counter of hits. At the end of the loop over batches, use this counter of hits to calculate the empirical coverage, emplevel and print a message with this value. YOUR-ANSWER- [CODE#14 ] "{r } bcover agemediananydist=NA # emp level=NA # compute the coverager # use this line of code as the last line in the body of your function: paste("Nominal level = ",1-alpha," Empirical level = ", emplevel) # 3
Step by Step Solution
There are 3 Steps involved in it
Step: 1
Get Instant Access to Expert-Tailored Solutions
See step-by-step solutions with expert insights and AI powered tools for academic success
Step: 2
Step: 3
Ace Your Homework with AI
Get the answers you need in no time with our AI-driven, step-by-step assistance