Answered step by step
Verified Expert Solution
Question
1 Approved Answer
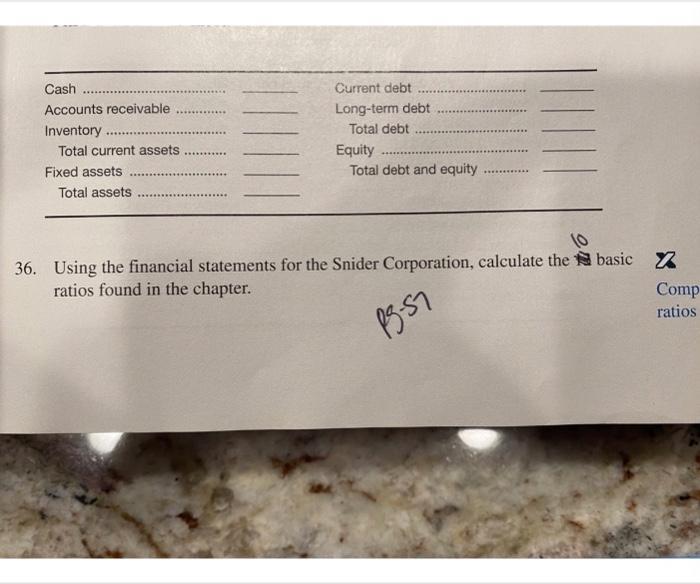
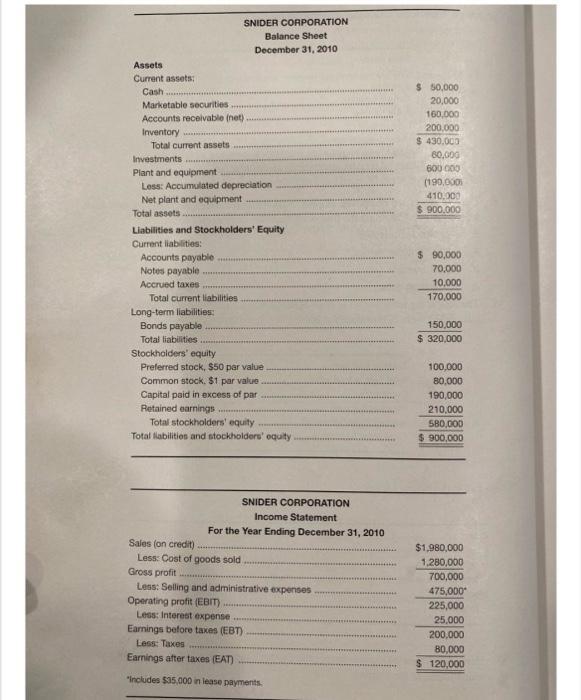
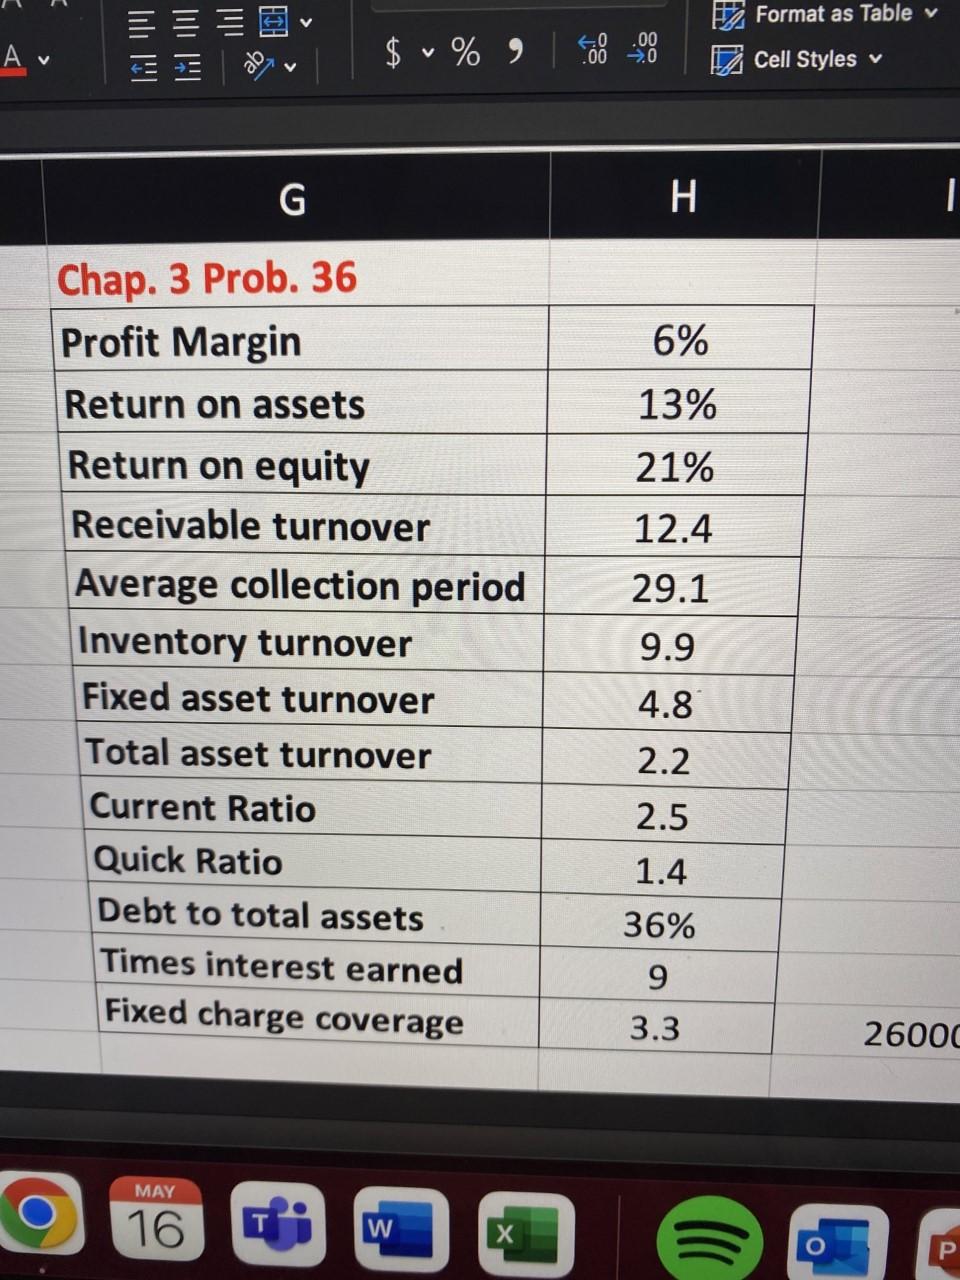
#36 with these ratios listed in picture 3 Cash Accounts receivable Inventory Total current assets Fixed assets ********* Total assets Current debt Long-term debt Total


#36 with these ratios listed in picture 3
Cash Accounts receivable Inventory Total current assets Fixed assets ********* Total assets Current debt Long-term debt Total debt Equity Total debt and equity 10 36. Using the financial statements for the Snider Corporation, calculate the basic X ratios found in the chapter. Comp ratios 05:51 $ 50,000 20.000 160.000 200,000 $430,000 60,000 600 000 (190,000 410.000 $.900.000 SNIDER CORPORATION Balance Sheet December 31, 2010 Assets Current assets Cash Marketable securities Accounts receivable (net) Inventory Total current assets Investments Plant and equipment Loss: Accumulated depreciation Net plant and equipment Total assets. Liabilities and Stockholders' Equity Current liabilities: Accounts payable ... Notes payable Accrued taxes Total current liabilities Long-term liabilities: Bonds payable Total liabilities Stockholders' equity Preferred stock, $50 par value Common stock. $1 par value Capital paid in excess of par Retained earnings Total stockholders' equity Total abilities and stockholders' equity $ 90,000 70,000 10,000 170,000 150,000 $ 320,000 100,000 80,000 190,000 210,000 580,000 $ 900,000 SNIDER CORPORATION Income Statement For the Year Ending December 31, 2010 Sales (on credit) Less: Cost of goods sold Gross profit Lens: Selling and administrative expenses Operating profit (EBIT) Less: Interest expense. Earnings before taxes (EBT) Less: Taxes Earnings after taxes (EAT) $1,980,000 1.280,000 700,000 475,000 225,000 25,000 200,000 80,000 $ 120,000 "Includes $35.000 in lease payments , Format as Table v .00 A V $ % 9 V 2 Cell Styles G H 6% 13% 21% 12.4 29.1 Chap. 3 Prob. 36 Profit Margin Return on assets Return on equity Receivable turnover Average collection period Inventory turnover Fixed asset turnover Total asset turnover Current Ratio Quick Ratio Debt to total assets Times interest earned Fixed charge coverage 9.9 4.8 1 2.2 2.5 1.4 36% 9 3.3 26000 MAY 16 W OO P Cash Accounts receivable Inventory Total current assets Fixed assets ********* Total assets Current debt Long-term debt Total debt Equity Total debt and equity 10 36. Using the financial statements for the Snider Corporation, calculate the basic X ratios found in the chapter. Comp ratios 05:51 $ 50,000 20.000 160.000 200,000 $430,000 60,000 600 000 (190,000 410.000 $.900.000 SNIDER CORPORATION Balance Sheet December 31, 2010 Assets Current assets Cash Marketable securities Accounts receivable (net) Inventory Total current assets Investments Plant and equipment Loss: Accumulated depreciation Net plant and equipment Total assets. Liabilities and Stockholders' Equity Current liabilities: Accounts payable ... Notes payable Accrued taxes Total current liabilities Long-term liabilities: Bonds payable Total liabilities Stockholders' equity Preferred stock, $50 par value Common stock. $1 par value Capital paid in excess of par Retained earnings Total stockholders' equity Total abilities and stockholders' equity $ 90,000 70,000 10,000 170,000 150,000 $ 320,000 100,000 80,000 190,000 210,000 580,000 $ 900,000 SNIDER CORPORATION Income Statement For the Year Ending December 31, 2010 Sales (on credit) Less: Cost of goods sold Gross profit Lens: Selling and administrative expenses Operating profit (EBIT) Less: Interest expense. Earnings before taxes (EBT) Less: Taxes Earnings after taxes (EAT) $1,980,000 1.280,000 700,000 475,000 225,000 25,000 200,000 80,000 $ 120,000 "Includes $35.000 in lease payments , Format as Table v .00 A V $ % 9 V 2 Cell Styles G H 6% 13% 21% 12.4 29.1 Chap. 3 Prob. 36 Profit Margin Return on assets Return on equity Receivable turnover Average collection period Inventory turnover Fixed asset turnover Total asset turnover Current Ratio Quick Ratio Debt to total assets Times interest earned Fixed charge coverage 9.9 4.8 1 2.2 2.5 1.4 36% 9 3.3 26000 MAY 16 W OO PStep by Step Solution
There are 3 Steps involved in it
Step: 1

Get Instant Access to Expert-Tailored Solutions
See step-by-step solutions with expert insights and AI powered tools for academic success
Step: 2

Step: 3

Ace Your Homework with AI
Get the answers you need in no time with our AI-driven, step-by-step assistance
Get Started


