Question
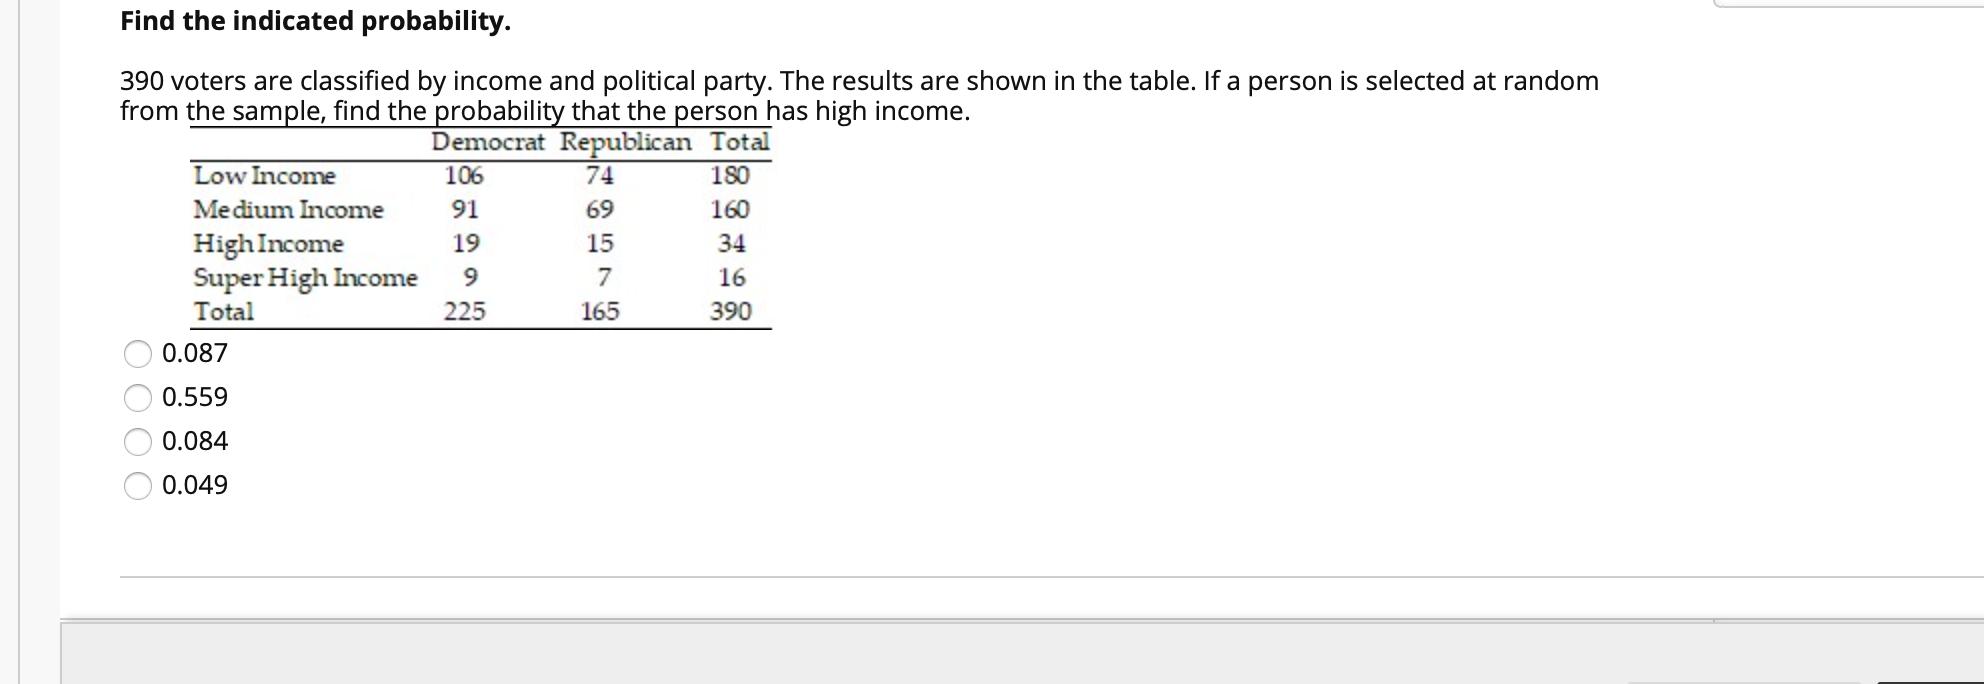
390 voters are classified by income and political party. The results are shown in the table. If a person is selected at random from the
390 voters are classified by income and political party. The results are shown in the table. If a person is selected at random from the sample, find the probability that the person has high income. 
Find the indicated probability. 390 voters are classified by income and political party. The results are shown in the table. If a person is selected at random from the sample, find the probability that the person has high income. Democrat Republican Total Low Income 106 74 180 Medium Income 91 69 160 HighIncome Super High Income Total 19 15 34 7 16 225 165 390 0.087 0.559 0.084 0.049
Step by Step Solution
3.59 Rating (160 Votes )
There are 3 Steps involved in it
Step: 1
Answer 0087 Calculation ...
Get Instant Access to Expert-Tailored Solutions
See step-by-step solutions with expert insights and AI powered tools for academic success
Step: 2

Step: 3

Ace Your Homework with AI
Get the answers you need in no time with our AI-driven, step-by-step assistance
Get StartedRecommended Textbook for
Essential Statistics
Authors: Robert Gould, Colleen N. Ryan, Rebecca Wong
2nd Edition
0134134400, 978-0134134406
Students also viewed these Mathematics questions
Question
Answered: 1 week ago
Question
Answered: 1 week ago
Question
Answered: 1 week ago
Question
Answered: 1 week ago
Question
Answered: 1 week ago
Question
Answered: 1 week ago
Question
Answered: 1 week ago
Question
Answered: 1 week ago
Question
Answered: 1 week ago
Question
Answered: 1 week ago
Question
Answered: 1 week ago
Question
Answered: 1 week ago
Question
Answered: 1 week ago
Question
Answered: 1 week ago
Question
Answered: 1 week ago
Question
Answered: 1 week ago
Question
Answered: 1 week ago
Question
Answered: 1 week ago
Question
Answered: 1 week ago
Question
Answered: 1 week ago
Question
Answered: 1 week ago
Question
Answered: 1 week ago
View Answer in SolutionInn App


