

Question
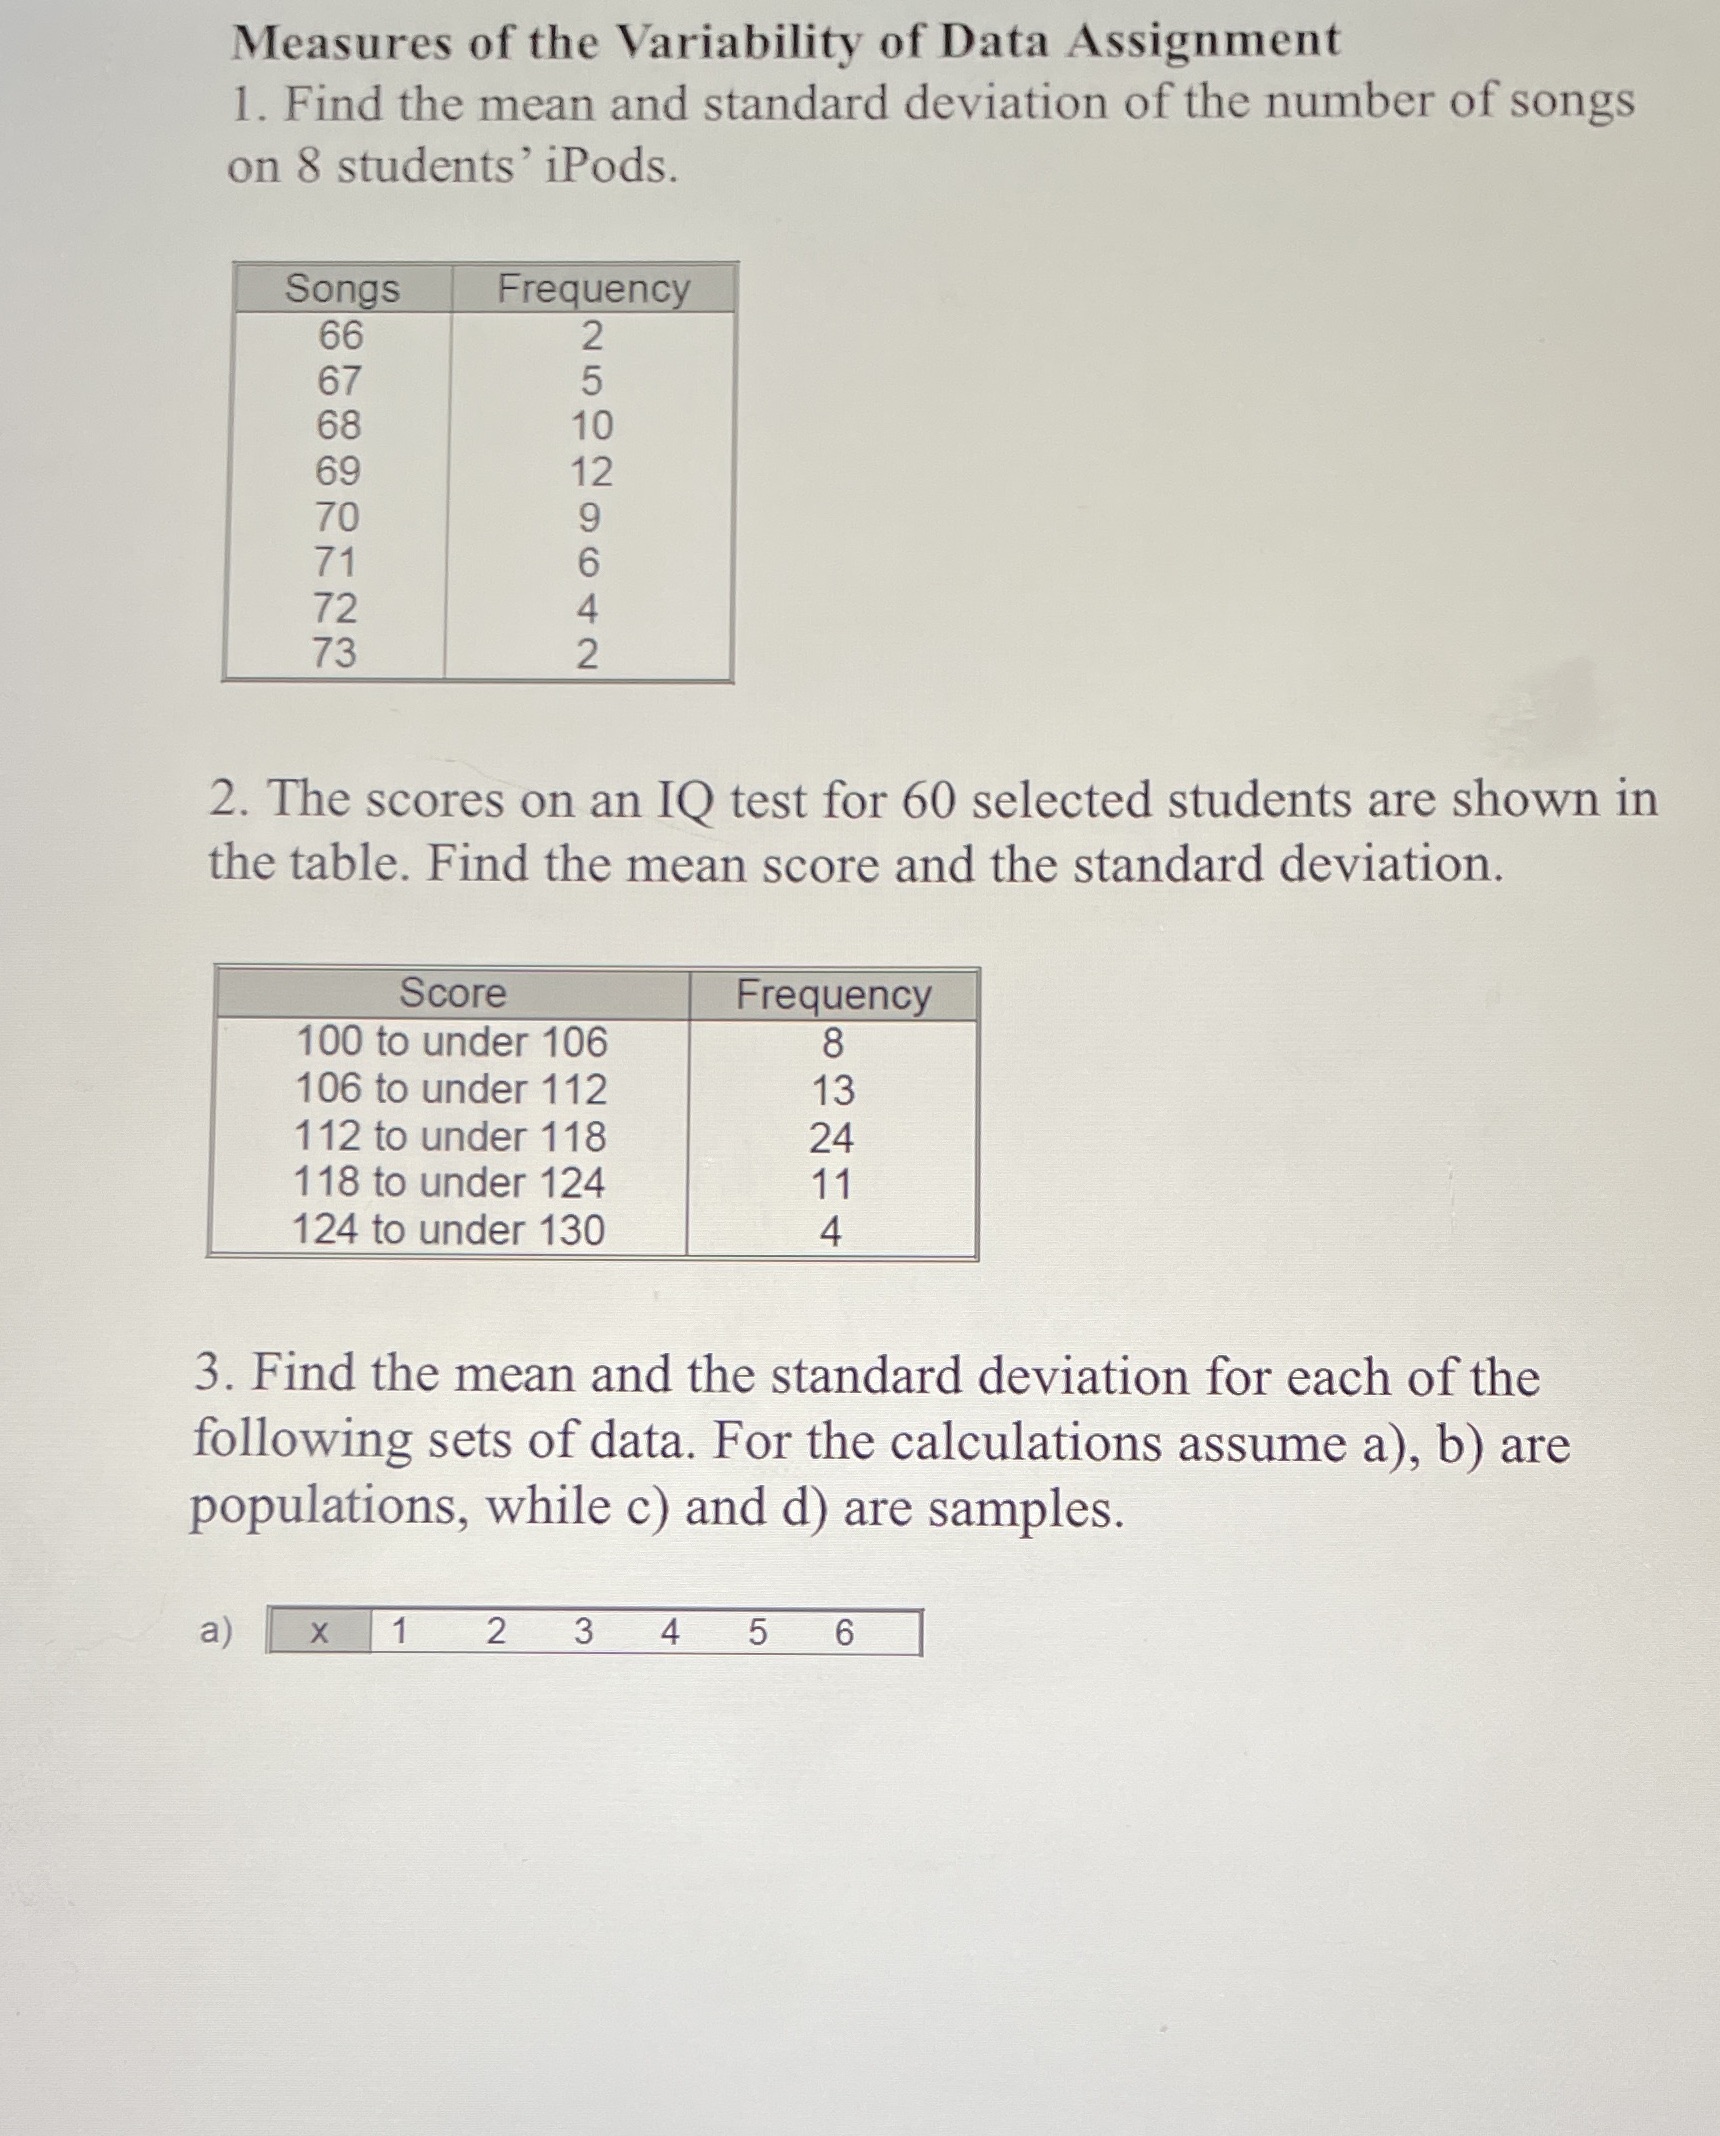
3b) Interval. FrequencyOne to under three. 2Three to under five. 4Five to under seven. 8Seven to under nine. 5Nine to under 11. 1C) interval. Frequency20
3b) Interval. FrequencyOne to under three. 2Three to under five. 4Five to under seven. 8Seven to under nine. 5Nine to under 11. 1C) interval. Frequency20 to under 25. 125 to under 30. 630 to under 35. 1035 to under 40. 240 to under 45 1D) X 10 20 30 40 50 60F 3 9 14. 10. 6. 4
Step by Step Solution
There are 3 Steps involved in it
Step: 1

Get Instant Access to Expert-Tailored Solutions
See step-by-step solutions with expert insights and AI powered tools for academic success
Step: 2

Step: 3
Ace Your Homework with AI
Get the answers you need in no time with our AI-driven, step-by-step assistance
Get Started
Theory Of Distributions
Authors: Svetlin G Georgiev
1st Edition
3319195271, 9783319195278