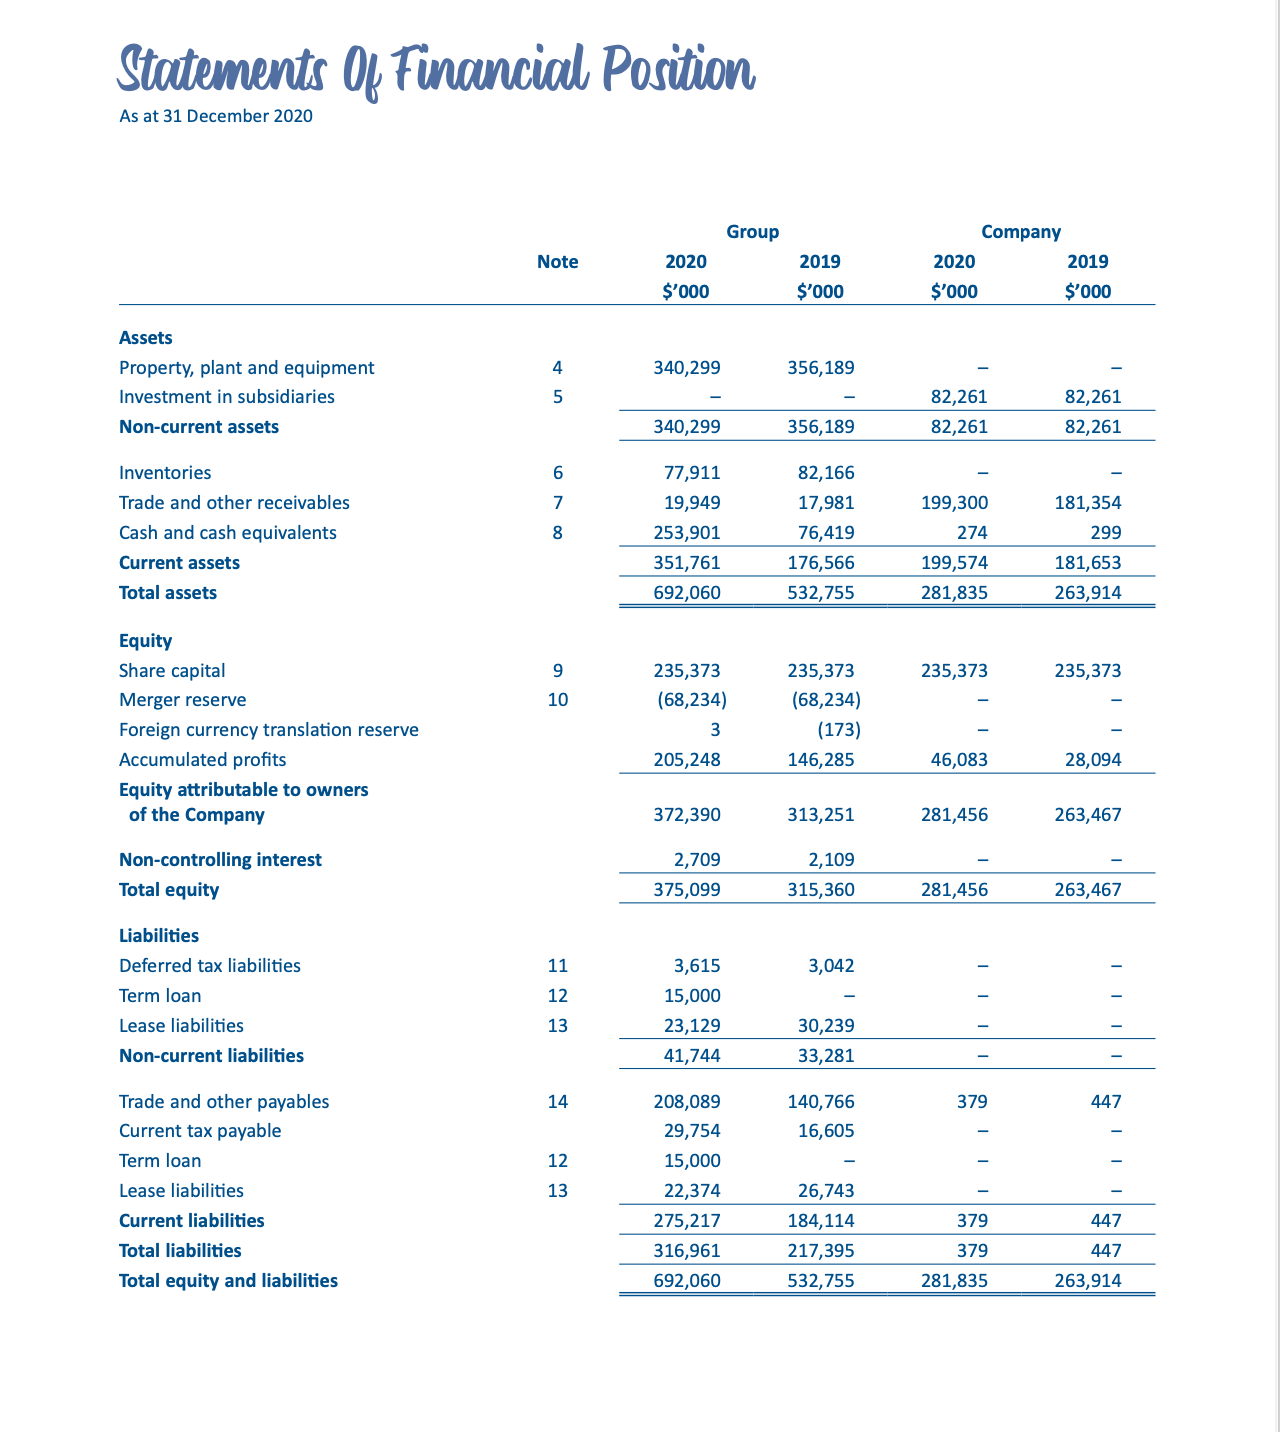
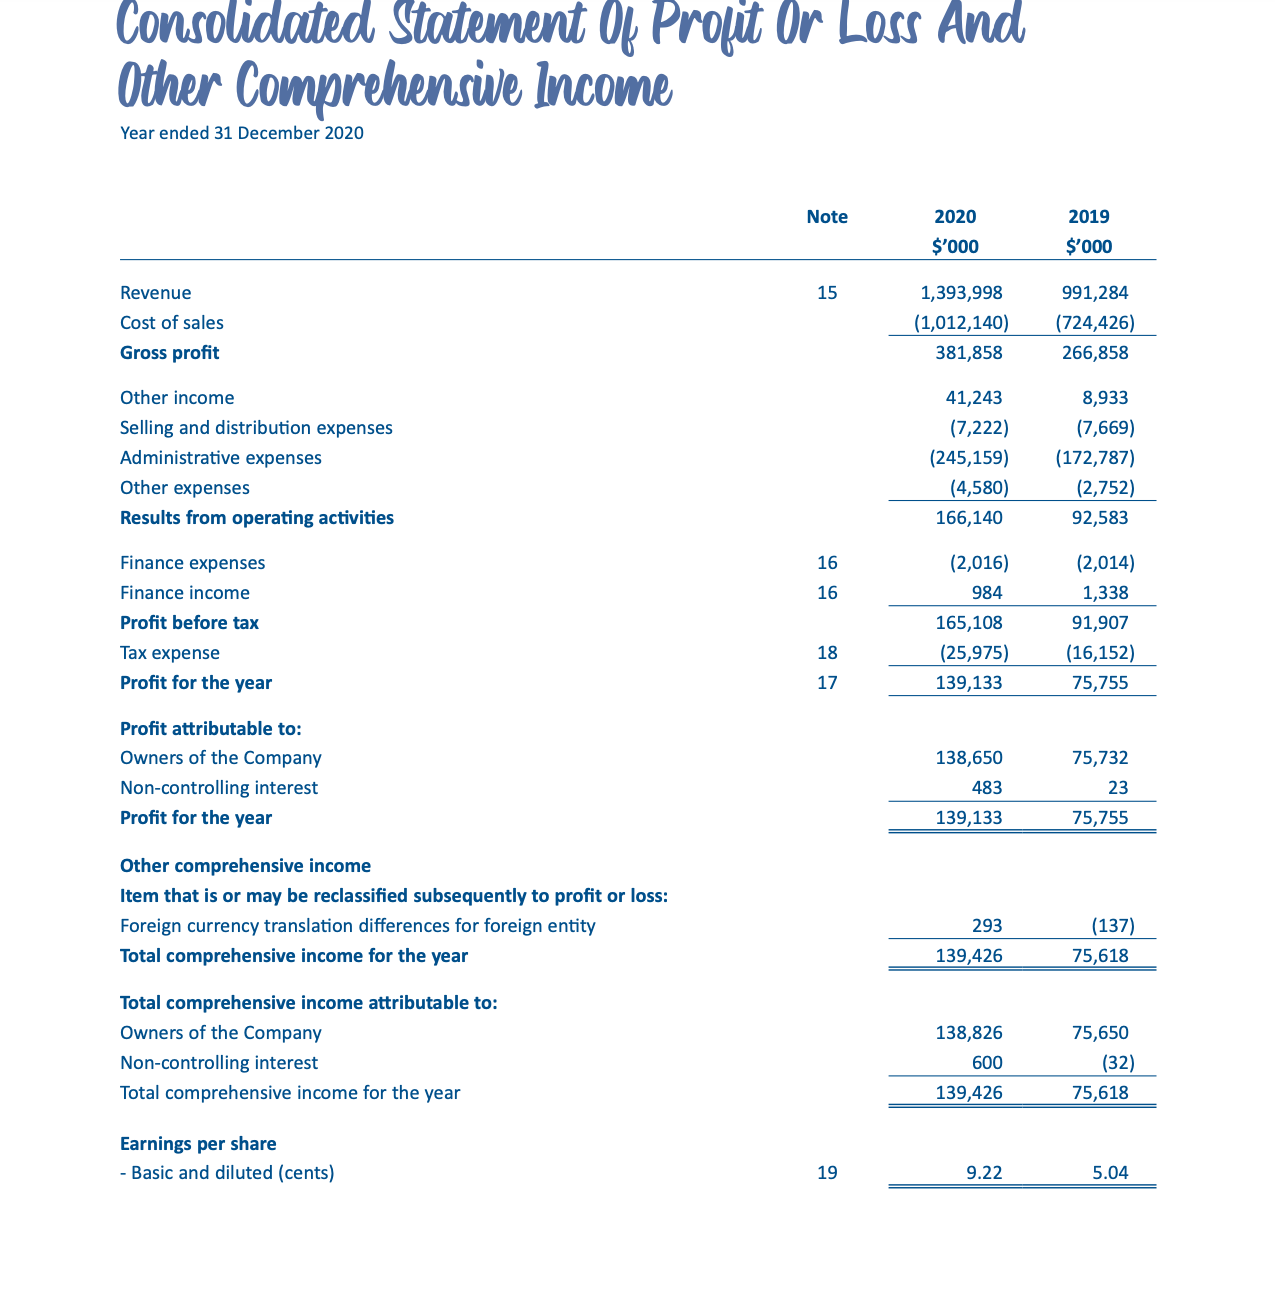
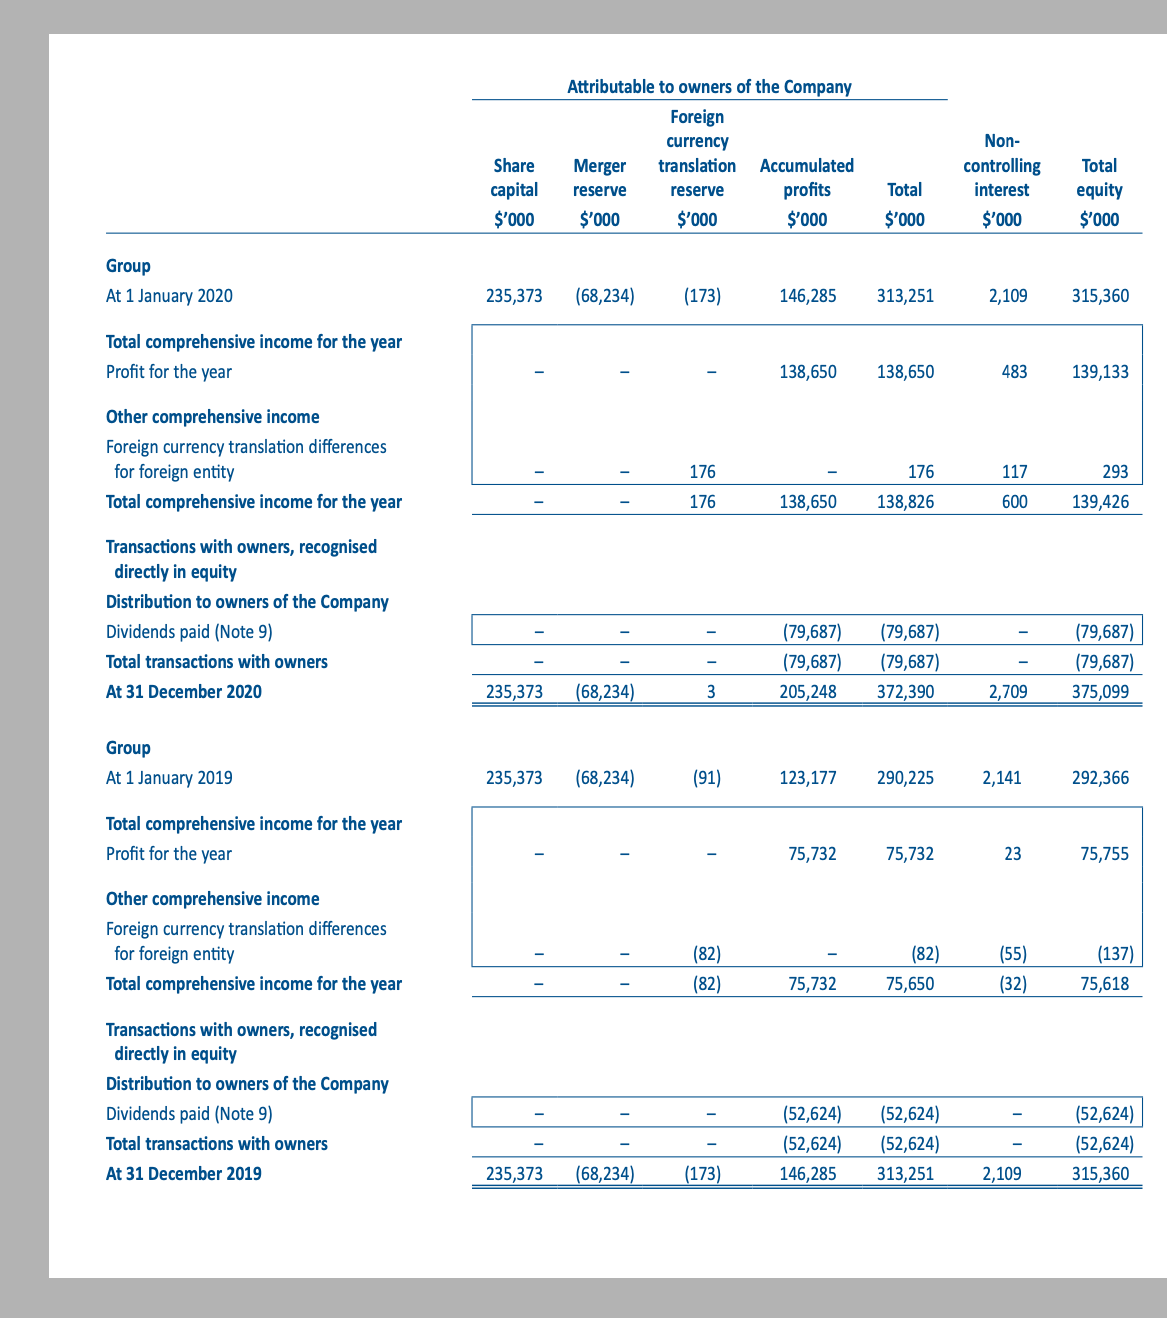
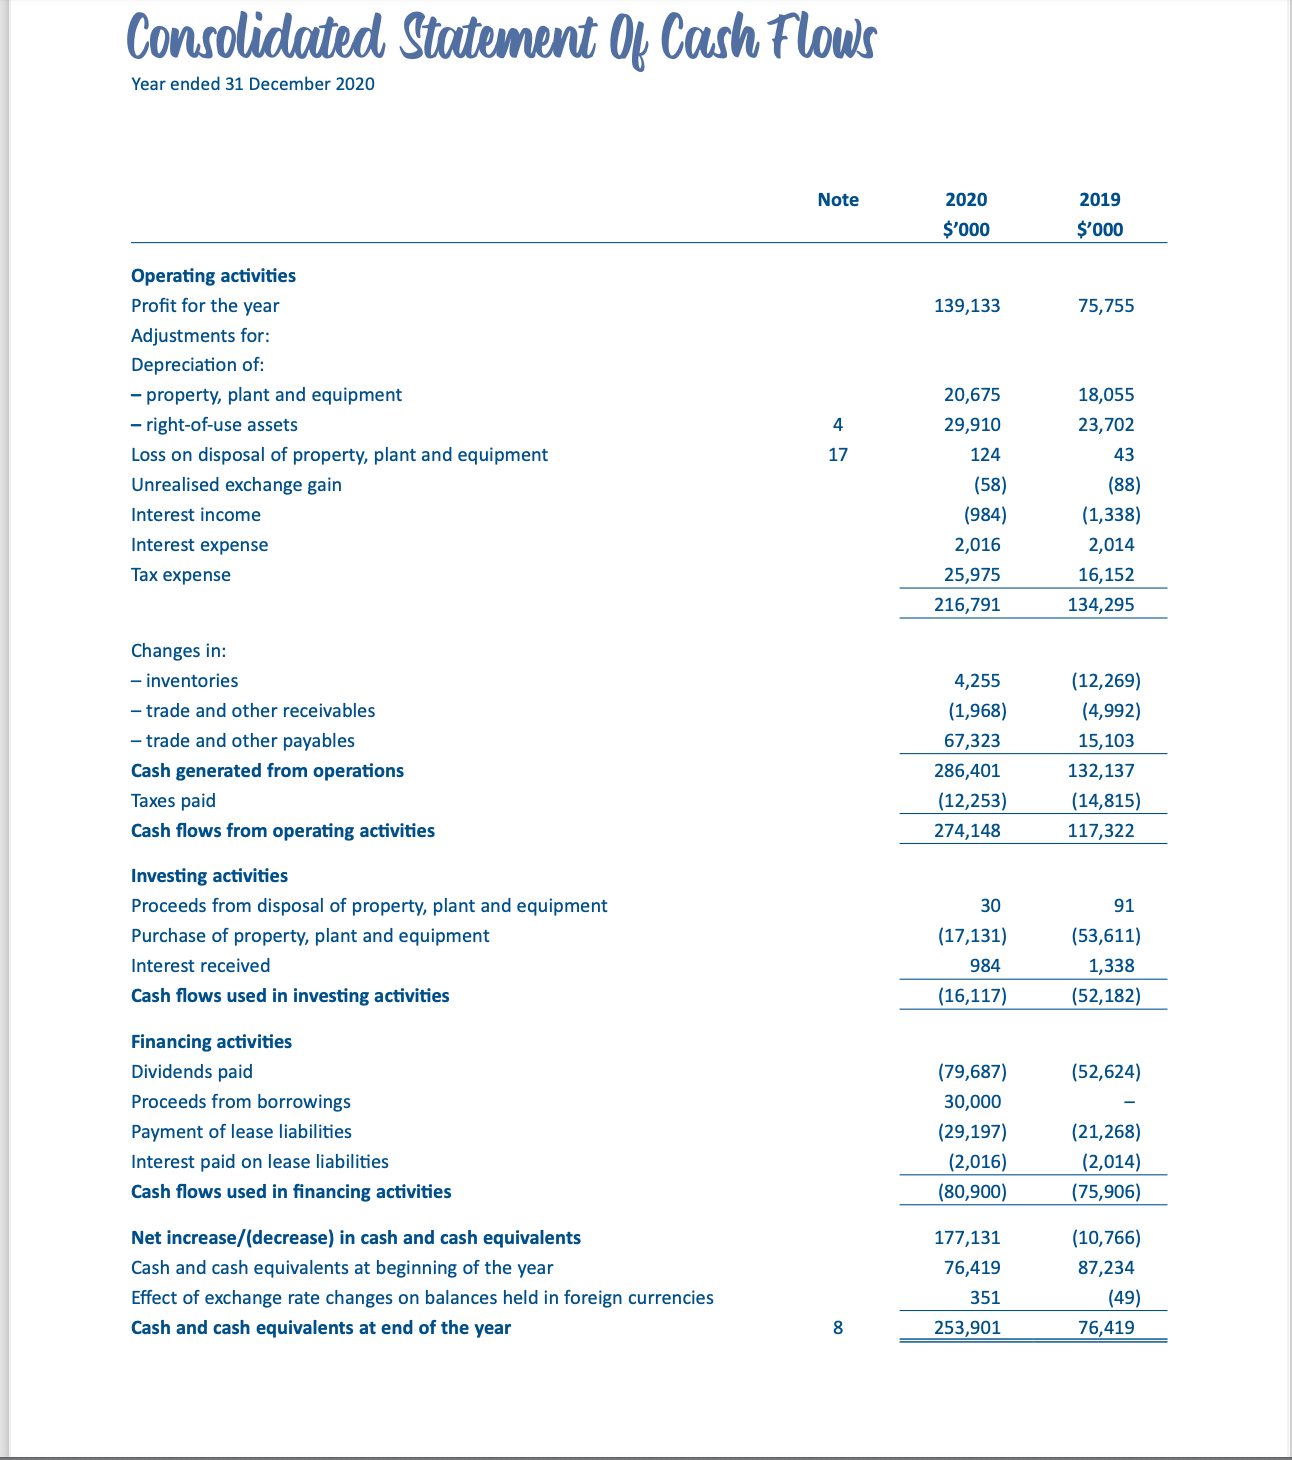
3mm: 09 mewial, Position As at 31 December 2020 Group Company Note 2020 2019 2020 2019 $'000 5'000 5'000 5'000 Assets Property, plant and equipment 4 340,299 356,189 Investment in subsidiaries 5 82,261 82,261 Non-current assets 340,299 356,189 82,261 82,261 Inventories 6 77,911 82,166 Trade and other receivables 7 19,949 17,981 199,300 181,354 Cash and cash equivalents 8 253,901 76,419 274 299 Current assets 351,761 176,566 199,574 181,653 Total assets 692,060 532,755 281,835 263,914 Equity Share capital 9 235,373 235,373 235,373 235,373 Merger reserve 10 (68,234) {68,234} Foreign currency translation reserve 3 (173) Accumulated prots 205,248 146,285 46,083 28,094 Equity attributable to owners of the Company 372,390 313,251 281,456 263,467 Non-controlling interest 2,709 2,109 Total equity 375,099 315,360 281,456 263,467 Liabilities Deferred tax liabilities 11 3,615 3,042 Term loan 12 15,000 Lease liabilities 13 23,129 30,239 Non-current liabilities 41,744 33,281 Trade and other payables 14 208,089 140,766 379 447 Current tax payable 29,754 16,605 Term loan 12 15,000 Lease liabilities 13 22,374 26,743 Current liabilities 275,217 184,114 379 447 Total liabilities 316,961 217,395 379 447 Total equity and liabilities 692,060 532,755 281,835 263,914 Consolidated Statement Of Profit Or Loss And Other Comprehensive Income Year ended 31 December 2020 Note 2020 2019 $'000 $'000 Revenue 15 1,393,998 991,284 Cost of sales (1,012,140) (724,426) Gross profit 381,858 266,858 Other income 41,243 8,933 Selling and distribution expenses (7,222) (7,669) Administrative expenses (245,159 (172,787) Other expenses (4,580) (2, 752) Results from operating activities 166,140 92,583 Finance expenses 16 (2,016) (2,014) Finance inco 16 984 1,338 Profit before tax 165,108 91,907 Tax expense 18 (25,975) (16,152) Profit for the year 17 139,133 75,755 Profit attributable to: Owners of the Company 138,650 75,732 Non-controlling interest 483 23 Profit for the year 139,133 75,755 Other comprehensive income Item that is or may be reclassified subsequently to profit or loss: Foreign currency translation differences for foreign entity 293 (137) Total comprehensive income for the year 139,426 75,618 Total comprehensive income attributable to: Owners of the Company 138,826 75,650 Non-controlling interest 600 (32) Total comprehensive income for the year 139,426 75,618 Earnings per share Basic and diluted (cents) 19 9.22 5.04Attributable to owners of the Company Foreign currency Non- Share Merger translation Accumulated controlling Total capital reserve reserve profits Total interest equity $'000 $'000 $'000 $'000 $'00 $'000 $'000 Group At 1 January 2020 235,373 (68,234) (173) 146,285 313,251 2,109 315,360 Total comprehensive income for the year Profit for the year 138,650 138,650 483 139,133 Other comprehensive income Foreign currency translation differences 176 176 293 for foreign entity 117 Total comprehensive income for the year 176 138,650 138,826 600 139,426 Transactions with owners, recognised directly in equity Distribution to owners of the Company Dividends paid (Note 9) (79,687) (79,687 ) (79,687) Total transactions with owners (79,687) (79,687) (79,687) W I At 31 December 2020 235,373 (68,234) 205,248 372,390 2,709 375,099 Group At 1 January 2019 235,373 (68,234) (91) 123,177 290,225 2,141 292,366 Total comprehensive income for the year Profit for the year 75,732 75,732 23 75,755 Other comprehensive income Foreign currency translation differences for foreign entity (82) (82) (55 (137) Total comprehensive income for the year (82) 75,732 75,650 (32) 75,618 Transactions with owners, recognised directly in equity Distribution to owners of the Company Dividends paid (Note 9) - (52,624) (52,624) (52,624) Total transactions with owners (52,624) (52,624) (52,624) At 31 December 2019 235,373 (68,234) (173) 146,285 313,251 2,109 315,360amounted gm 0, own new Year ended 31 December 2020 Note 2020 2019 $000 $'000 Operating activities Prot for the year 139,133 75,755 Adjustments for: Depreciation of: - property, plant and equipment 20,675 18,055 - right-ofuse assets 4 29,910 23,702 Loss on disposal of property, plant and equipment 17 124 43 Unrealised exchange gain (58} (88} Interest income [984} {1,338} Interest expense 2,016 2,014 Tax expense 25,975 16,152 216,791 134,295 Changes in: inventories 4,255 (12,259} trade and other receivables {1,968} {4,992} trade and other payables 67,323 15,103 Cash generated from operations 286,401 132,137 Taxes paid {12,253} (14,815} Cash flows from operating activities 274,148 117,322 Investing activities Proceeds from disposal of property, plant and equipment 30 91 Purchase of property, plant and equipment {17,131} (53,611} Interest received 984 1,338 Cash flows used in investing activities {16,117} (52,182} Financing activities Dividends paid {79,687} (52,624} Proceeds from borrowings 30,000 Payment of lease liabilities {29,197} (21,268} Interest paid on lease liabilities {2,016} {2,014} Cash flows used in nancing activities {80,900} (75,906} Net increase/(decrease} in cash and cash equivalents 177,131 {10,766} Cash and cash equivalents at beginning of the year 76,419 37,234 Effect of exchange rate changes on balances held in foreign currencies 351 [49} Cash and cash equivalents at end of the year 8 253,901 76,419


