3rd Pic is question
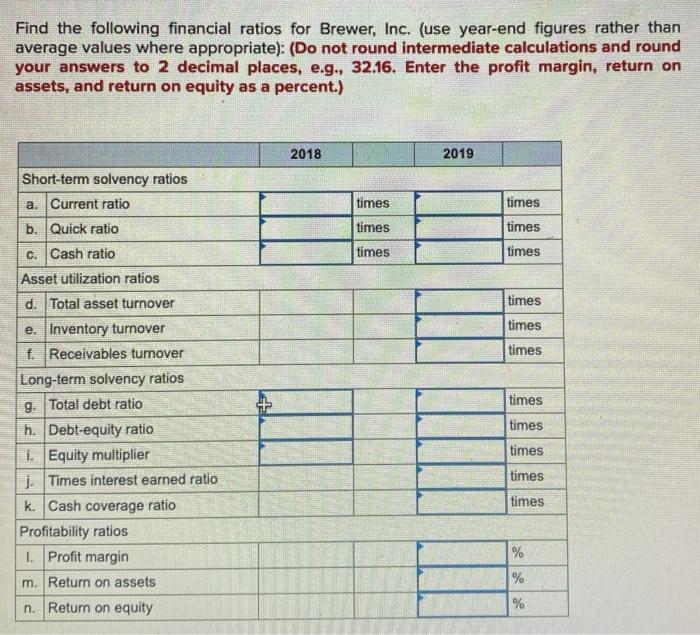
Find the following financial ratios for Brewer, Inc. (use year-end figures rather than average values where appropriate): (Do not round intermediate calculations and round your answers to 2 decimal places, e.g., 32.16Enter the profit margin, return on assets, and return on equity as a percent .)
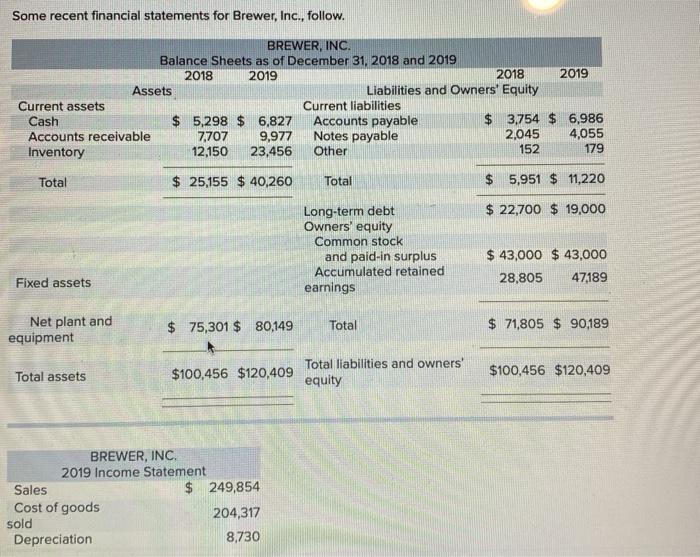
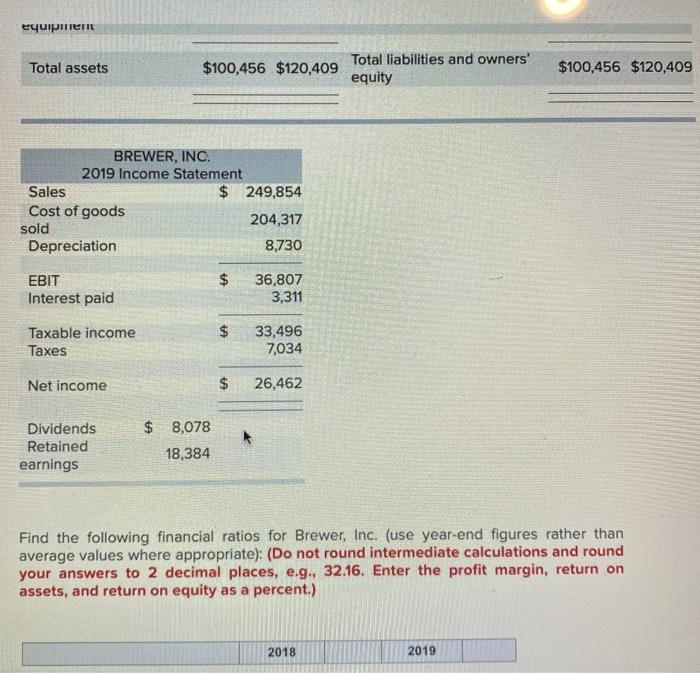
Some recent financial statements for Brewer, Inc., follow. BREWER, INC. Balance Sheets as of December 31, 2018 and 2019 2018 2019 2018 2019 Assets Liabilities and Owners' Equity Current assets Current liabilities Cash $ 5,298 $ 6,827 Accounts payable $ 3,754 $ 6,986 Accounts receivable 7,707 9,977 Notes payable 2.045 4,055 Inventory 12,150 23,456 Other 152 179 Total $ 25,155 $ 40,260 Total $ 5,951 $ 11,220 $ 22,700 $ 19,000 Long-term debt Owners' equity Common stock and paid-in surplus Accumulated retained earnings $ 43,000 $ 43,000 28,805 47189 Fixed assets Net plant and equipment $ 75,301 $ 80,149 Total $ 71,805 $ 90,189 Total assets $100,456 $120,409 Total liabilities and owners' equity $100,456 $120,409 BREWER, INC. 2019 Income Statement Sales $ 249,854 Cost of goods 204,317 sold Depreciation 8,730 Total assets $100,456 $120,409 Total liabilities and owners' equity $100,456 $120,409 BREWER, INC. 2019 Income Statement Sales $ 249,854 Cost of goods 204,317 sold Depreciation 8,730 $ EBIT Interest paid 36,807 3,311 $ Taxable income Taxes 33,496 7,034 Net income $ 26,462 Dividends Retained earnings $ 8,078 18,384 Find the following financial ratios for Brewer, Inc. (use year-end figures rather than average values where appropriate): (Do not round intermediate calculations and round your answers to 2 decimal places, e.g., 32.16. Enter the profit margin, return on assets, and return on equity as a percent.) 2018 2019 Find the following financial ratios for Brewer, Inc. (use year-end figures rather than average values where appropriate): (Do not round intermediate calculations and round your answers to 2 decimal places, e.g., 32.16. Enter the profit margin, return on assets, and return on equity as a percent.) 2018 2019 times times times times times times times times times Short-term solvency ratios a. Current ratio b. Quick ratio C. Cash ratio Asset utilization ratios d. Total asset turnover e. Inventory turnover f. Receivables turnover Long-term solvency ratios g. Total debt ratio h. Debt-equity ratio i. Equity multiplier j. Times interest earned ratio k. Cash coverage ratio Profitability ratios L. Profit margin m. Return on assets n. Return on equity times times times times times % % %