

Answered step by step
Verified Expert Solution
Question
1 Approved Answer
4 (16 marks) The 2020 three year comparative financial statements of Serena Williams Ltd. follow: Serena Williams Ltd. Balance Sheet December 31 Assets Cash Investments
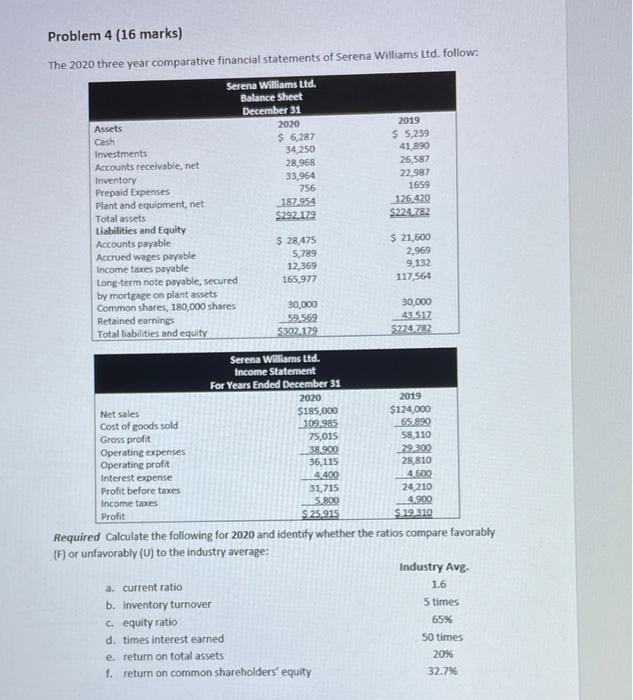 4 (16 marks) The 2020 three year comparative financial statements of Serena Williams Ltd. follow: Serena Williams Ltd. Balance Sheet December 31 Assets Cash Investments Accounts receivable, net Inventory 2020 2019 $ 6,287 $ 5,239 34,250 41,890 28,968 26,587 33,964 22,987 Prepaid Expenses 756 1659 Plant and equipment, net 187.954 Total assets $292.179 Liabilities and Equity Accounts payable $28,475 Accrued wages payable 5,789 126.420 $224,782 $ 21,600 2,969 Income taxes payable 12,369 9,132 Long-term note payable, secured 165,977 117,564 by mortgage on plant assets Retained earnings Common shares, 180,000 shares Total liabilities and equity Serena Williams Ltd. Income Statement For Years Ended December 31 30,000 30,000 59.569 43.517 $302.179 $224.782 Net sales Cost of goods sold Gross profit Operating expenses Operating profit Interest expense Profit before taxes Income taxes Profit 2020 $185,000 2019 $124,000 109.985 65.890 75,015 58,110 38.900 29,300 36,115 28,810 4.400 4.600 31,715 24,210 5,800 4.900 $25,915 $19.310 Required Calculate the following for 2020 and identify whether the ratios compare favorably (F) or unfavorably (U) to the industry average: a. current ratio b. inventory turnover c. equity ratio Industry Avg. 1.6 5 times 65% d. times interest earned e. return on total assets f. return on common shareholders' equity 50 times 20% 32.7%
 Step by Step Solution
There are 3 Steps involved in it
Step: 1

Get Instant Access to Expert-Tailored Solutions
See step-by-step solutions with expert insights and AI powered tools for academic success
Step: 2

Step: 3
Ace Your Homework with AI
Get the answers you need in no time with our AI-driven, step-by-step assistance
Get Started
Accounting Principles
Authors: Jerry J. Weygandt, Donald E. Kieso, Paul D. Kimmel, Barbara Trenholm, Valerie Warren, Lori Novak
7th Canadian Edition Volume 2
1119048478, 978-1119048473