Answered step by step
Verified Expert Solution
Link Copied!

Question

1 Approved Answer

4. Calculate the expected return, variance, and standard deviation for the stocks in the table below. Product Probability Stock #1 Stock #2 Stock #3 Demand

image text in transcribed
4. Calculate the expected return, variance, and standard deviation for the stocks in the table below. Product Probability Stock #1 Stock #2 Stock #3 Demand High 20% 30% 20% 15% Medium 60% 12% 14% 10% Low 20% -10% -5% -29% A B D E F G 2 Stock 2 Stock 3 3 Probability Stock 1 20% 30 60% 12 20% -10 15 4 5 20 14 10 5 6 -5 -2 6 7 8 8 Var 9 Std. Dev 10 Expected Return 11 12 13 Follow the instructions on the exercise sheet. 14 15 16 17

Step by Step Solution

There are 3 Steps involved in it

Step: 1

blur-text-image

Get Instant Access to Expert-Tailored Solutions

See step-by-step solutions with expert insights and AI powered tools for academic success

Step: 2

blur-text-image_2

Step: 3

blur-text-image_3

Ace Your Homework with AI

Get the answers you need in no time with our AI-driven, step-by-step assistance

Get Started

Recommended Textbook for

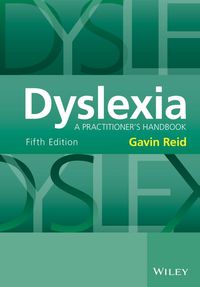
Dyslexia A Practitioners Handbook

Authors: Gavin Reid

5th Edition

1118980107, 9781118980101

More Books

Students also viewed these Accounting questions

Question

your ultimate goal upon graduation (i.e., career goals).

Answered: 1 week ago

Question

Be able to schedule and conduct a performance appraisal interview

Answered: 1 week ago

Question

Know the two most common approaches to appraisal timing

Answered: 1 week ago