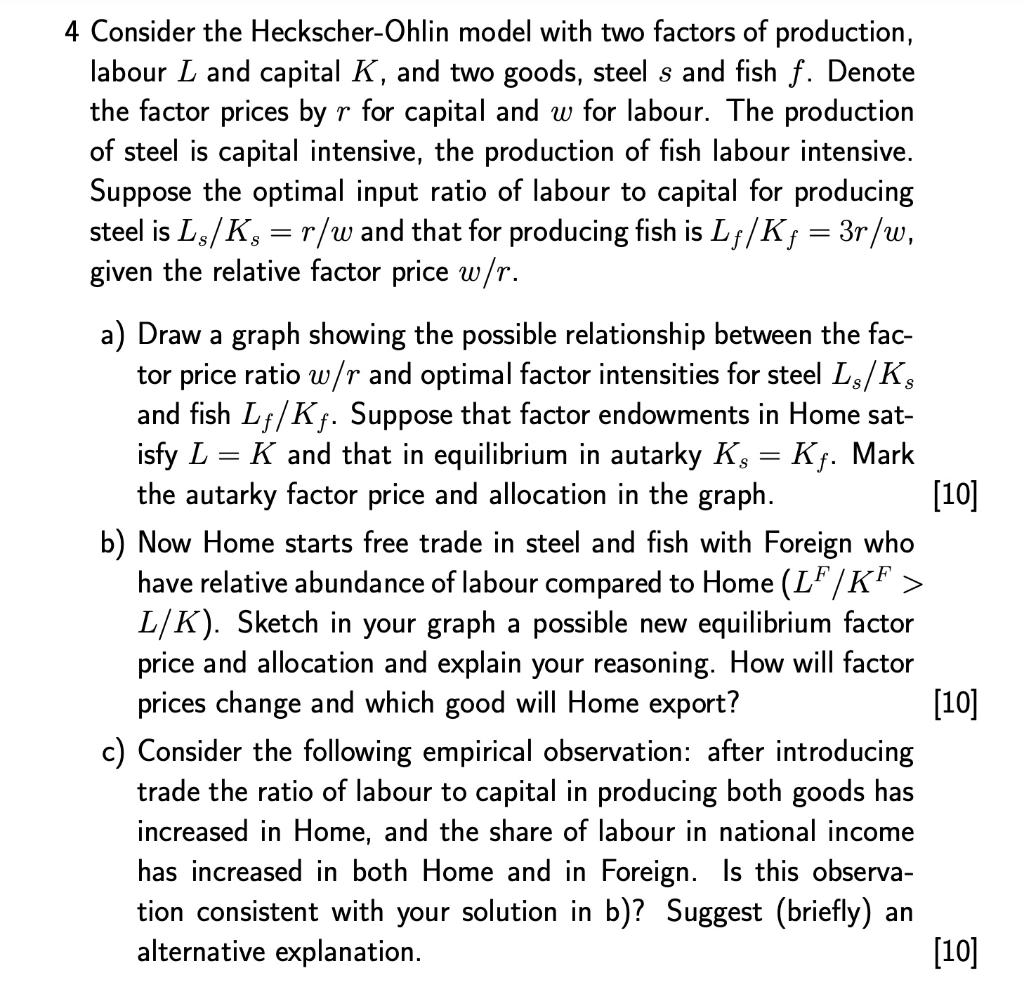
4 Consider the Heckscher-Ohlin model with two factors of production, labour L and capital K, and two goods, steel s and fish f. Denote the factor prices by r for capital and w for labour. The production of steel is capital intensive, the production of fish labour intensive. Suppose the optimal input ratio of labour to capital for producing steel is Ls/Ks = r/w and that for producing fish is Lf/K = 3r/w, given the relative factor price w/r. a) Draw a graph showing the possible relationship between the fac- tor price ratio w/r and optimal factor intensities for steel Ls/Ks and fish L/K. Suppose that factor endowments in Home sat- isfy L = K and that in equilibrium in autarky K, = K. Mark the autarky factor price and allocation in the graph. [10] b) Now Home starts free trade in steel and fish with Foreign who have relative abundance of labour compared to Home (LF/KF > L/K). Sketch in your graph a possible new equilibrium factor price and allocation and explain your reasoning. How will factor prices change and which good will Home export? [10] c) Consider the following empirical observation: after introducing trade the ratio of labour to capital in producing both goods has increased in Home, and the share of labour in national income has increased in both Home and in Foreign. Is this observa- tion consistent with your solution in b)? Suggest (briefly) an alternative explanation. [10] 4 Consider the Heckscher-Ohlin model with two factors of production, labour L and capital K, and two goods, steel s and fish f. Denote the factor prices by r for capital and w for labour. The production of steel is capital intensive, the production of fish labour intensive. Suppose the optimal input ratio of labour to capital for producing steel is Ls/Ks = r/w and that for producing fish is Lf/K = 3r/w, given the relative factor price w/r. a) Draw a graph showing the possible relationship between the fac- tor price ratio w/r and optimal factor intensities for steel Ls/Ks and fish L/K. Suppose that factor endowments in Home sat- isfy L = K and that in equilibrium in autarky K, = K. Mark the autarky factor price and allocation in the graph. [10] b) Now Home starts free trade in steel and fish with Foreign who have relative abundance of labour compared to Home (LF/KF > L/K). Sketch in your graph a possible new equilibrium factor price and allocation and explain your reasoning. How will factor prices change and which good will Home export? [10] c) Consider the following empirical observation: after introducing trade the ratio of labour to capital in producing both goods has increased in Home, and the share of labour in national income has increased in both Home and in Foreign. Is this observa- tion consistent with your solution in b)? Suggest (briefly) an alternative explanation. [10]


