Answered step by step
Verified Expert Solution
Question
1 Approved Answer
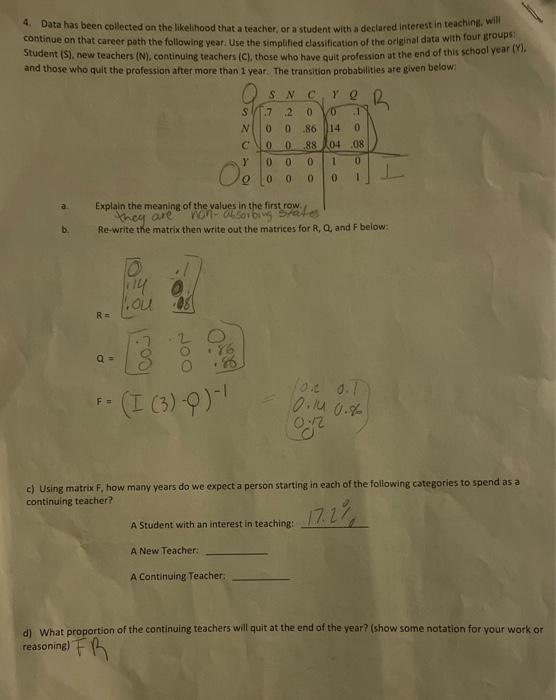
4. Data has been collected on the likelihood that a teacher, or a student with a declared interest in teaching, will continue on that

4. Data has been collected on the likelihood that a teacher, or a student with a declared interest in teaching, will continue on that career path the following year. Use the simplified classification of the original data with four groups Student (S), new teachers (N), continuing teachers (C), those who have quit profession at the end of this school year (Y). and those who quit the profession after more than 1 year. The transition probabilities are given below: a. b. R = Q = S N Y Oe Py of ou Explain the meaning of the values in the first row. they are non-absorbing state Re-write the matrix then write out the matrices for R, Q, and F below:- +86 SN C Y Q R .7 2 0 /0 1 0 0 .86 14 0 0 F = ** (I (3) -9)-1 20 8804 08 0 0 0 1 0 0 0 0 0 1 0.2 0.1 0.10 0.86 0.12 A Student with an interest in teaching: A New Teacher: A Continuing Teacher: c) Using matrix F, how many years do we expect a person starting in each of the following categories to spend as a continuing teacher? 17.2% d) What proportion of the continuing teachers will quit at the end of the year? (show some notation for your work or reasoning) FR
Step by Step Solution
★★★★★
3.49 Rating (156 Votes )
There are 3 Steps involved in it
Step: 1
The given transition probability matrix represents the likelihood of individuals transitioning between different career paths in teaching The matrix i...
Get Instant Access to Expert-Tailored Solutions
See step-by-step solutions with expert insights and AI powered tools for academic success
Step: 2

Step: 3

Ace Your Homework with AI
Get the answers you need in no time with our AI-driven, step-by-step assistance
Get Started


