

Answered step by step
Verified Expert Solution
Question
1 Approved Answer
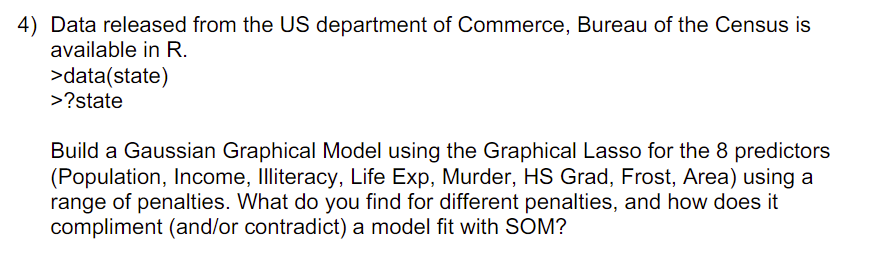
4) Data released from the US department of Commerce, Bureau of the Census is available in R, >data(state) >7state Build a Gaussian Graphical Model using
Step by Step Solution
There are 3 Steps involved in it
Step: 1

Get Instant Access to Expert-Tailored Solutions
See step-by-step solutions with expert insights and AI powered tools for academic success
Step: 2

Step: 3
Ace Your Homework with AI
Get the answers you need in no time with our AI-driven, step-by-step assistance
Get Started
Precalculus
Authors: Michael Sullivan
9th edition
321716835, 321716833, 978-0321716835