Question
4. Draw the diagram for the given values using the Tanh activation function. X=0.5, 1, -0.7, 2, -2, 2.5 [Not handwritten] 5. Draw the

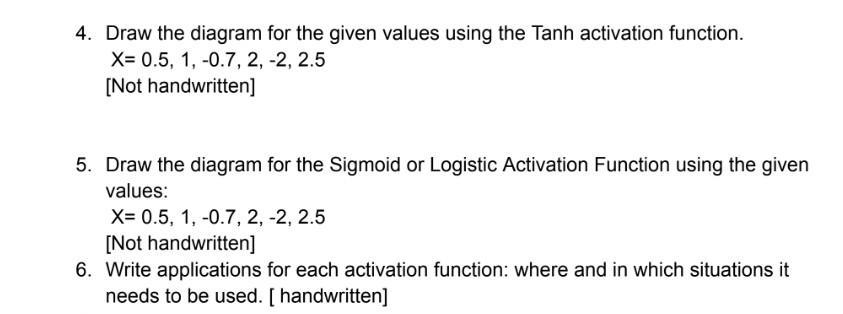
4. Draw the diagram for the given values using the Tanh activation function. X=0.5, 1, -0.7, 2, -2, 2.5 [Not handwritten] 5. Draw the diagram for the Sigmoid or Logistic Activation Function using the given values: X=0.5, 1, -0.7, 2, -2, 2.5 [Not handwritten] 6. Write applications for each activation function: where and in which situations it needs to be used. [ handwritten]
Step by Step Solution
There are 3 Steps involved in it
Step: 1

Get Instant Access to Expert-Tailored Solutions
See step-by-step solutions with expert insights and AI powered tools for academic success
Step: 2

Step: 3

Ace Your Homework with AI
Get the answers you need in no time with our AI-driven, step-by-step assistance
Get StartedRecommended Textbook for
Computer Architecture A Quantitative Approach
Authors: John L. Hennessy, David A. Patterson
6th Edition
0128119055, 978-0128119051
Students also viewed these Programming questions
Question
Answered: 1 week ago
Question
Answered: 1 week ago
Question
Answered: 1 week ago
Question
Answered: 1 week ago
Question
Answered: 1 week ago
Question
Answered: 1 week ago
Question
Answered: 1 week ago
Question
Answered: 1 week ago
Question
Answered: 1 week ago
Question
Answered: 1 week ago
Question
Answered: 1 week ago
Question
Answered: 1 week ago
Question
Answered: 1 week ago
Question
Answered: 1 week ago
Question
Answered: 1 week ago
Question
Answered: 1 week ago
Question
Answered: 1 week ago
Question
Answered: 1 week ago
Question
Answered: 1 week ago
Question
Answered: 1 week ago
Question
Answered: 1 week ago
Question
Answered: 1 week ago
View Answer in SolutionInn App


