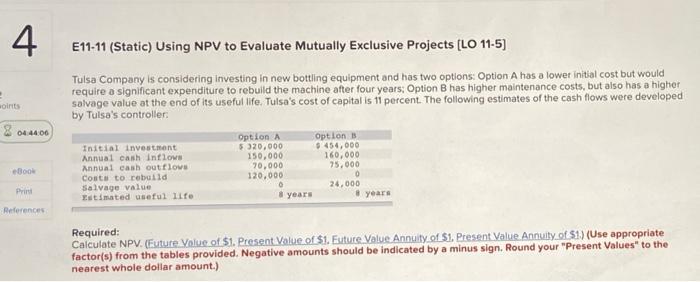
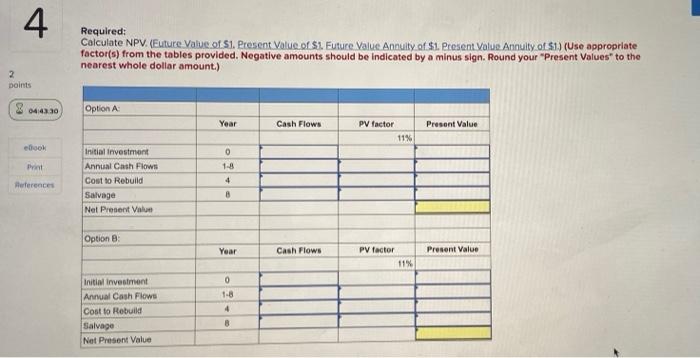
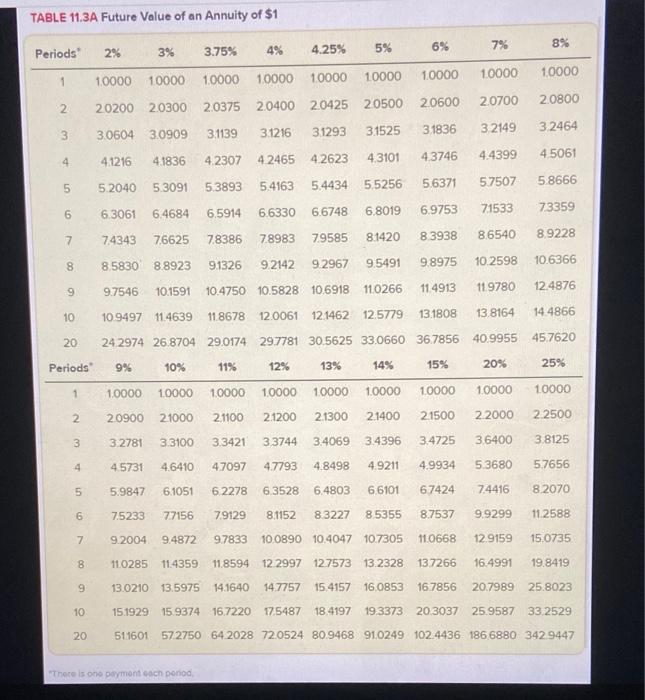
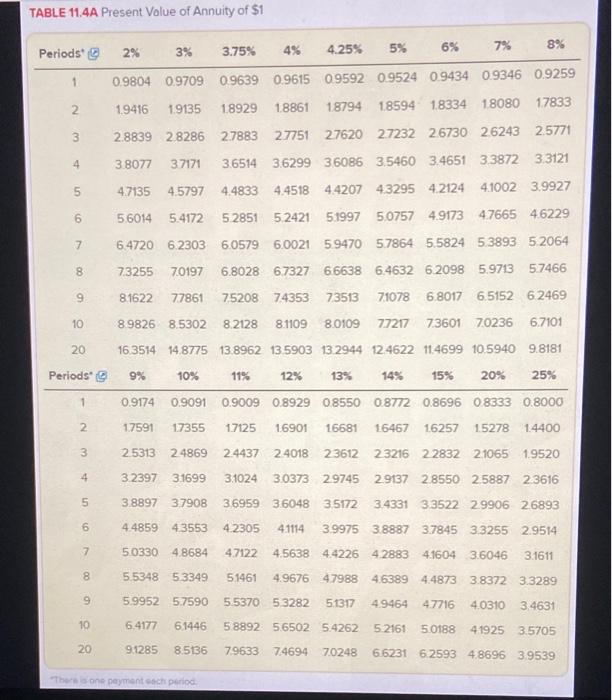
4 E11-11 (Static) Using NPV to Evaluate Mutually Exclusive Projects (LO 11-5) oints 8 044406 Tulsa Company is considering investing in new bottling equipment and has two options: Option A has a lower initial cost but would require a significant expenditure to rebuild the machine after four years: Option B has higher maintenance costs, but also has a higher salvage value at the end of its useful life. Tulsa's cost of capital is 11 percent. The following estimates of the cash flows were developed by Tulsa's controller Option Option Initial investment 5.320,000 $454,000 Annual cash inflows 150,000 160,000 Annual cash out flowe 70,000 75,000 Cost to rebuild 120,000 Salvage value 24,000 Estimated useful life 1 years 8 years 300 0 Prisi References Required: Calculate NPV. (Future Value of $1. Present Value of $1. Future Value Annuity of $1. Present Value Annuity of 51) (Use appropriate factor(s) from the tables provided. Negative amounts should be indicated by a minus sign. Round your "Present Values" to the nearest whole dollar amount.) 4 Required: Calculate NPV. (Euture Value of $1. Present Value of $1. Future Value Annuity of $1. Present Value Annuity of S1) (Use appropriate factor(s) from the tables provided. Negative amounts should be indicated by a minus sign. Round your "Present Values" to the nearest whole dollar amount.) 2 points 0414330 Option A Year Cash Flows Present Value PV factor 11% ebook 0 Print 1-8 Initial investment Annual Cash Flows Cost to Rebuild Salvage Net Present Value 4 References 8 Option : Year Cash Flows Present Value PV factor 11% 0 1-8 Initial investment Annual Cash Flows Cost to Rebuild Salvage Net Present Value 4 B Determine which option Tulsa should select? O Option B O Option A TABLE 11.1A Future Value of $1 Periods 2% 3% 3.75% 4.25% 5% 6% 7% 8% 0 10000 10000 10000 10000 10000 10000 10000 10000 10000 10200 10300 10375 10400 10425 10500 10500 1 10700 10800 2 10404 10609 10764 10816 10868 11025 11236 11449 11664 3 10612 10927 1.1168 11249 11330 11576 11910 12250 12597 4 10824 11255 1.1587 1.1699 11811 12155 12625 13108 13605 5 11041 1.1593 12021 12167 12313 12763 13382 14026 14693 6 11262 11941 12472 12653 12837 13401 14185 15007 15869 7 1.1487 12299 12939 1315913382 14071 15036 16058 17138 8 11717 12668 13425 13686 13951 14775 15938 17182 18509 9 11951 13048 13928 1.4233 14544 15513 16895 18385 19990 10 12190 13439 1.4450 1480215162 16289 17906 19672 21589 20 14859 18061 20882 21911 22989 26533 32071 3.8697 46610 Periods 9% 10% 11% 12% 13% 14% 15% 20% 25% 0 1.0000 10000 10000 10000 10000 10000 10000 10000 10000 1 10900 11000 11100 11200 11300 11400 11500 1 2000 12500 2 11881 12100 12321 12544 12769 12996 13225 14400 15625 3 12950 13310 13676 14049 14429 14815 15209 17280 19531 4 1.4116 14641 1.5181 15735 16305 16890 17490 20736 24414 un 1.5386 16105 16851 17623 18424 19254 20114 24883 30518 6 16771 17716 18704 19738 20820 21950 23131 2.9860 3 8147 1.8280 19487 2.0762 22107 23526 25023 26600 3.5832 47684 00 19926 21436 23045 24760 26584 28526 30590 4 2998 5.9605 9 2.1719 23579 2.5580 2.7731 3.0040 32519 35179 51598 74506 10 23674 25937 2.8394 31058 3.3946 37072 40456 6 1917 93132 20 5.6044 67275 8062396463115231 137435 16.3665 38.3376 86 7362 TABLE 11.2A Present Value of $1 8% Periods 2% 3% 5% 7% 3.75% 4% 4.25% 6% 1 0.9804 0.9709 0.9639 0.9615 0.9592 0.9524 0.9434 0.9346 0.9259 2 3 0.9612 0.9426 0.9290 0.9246 0.9201 0.9070 0.8900 0.8734 0.8573 0.9423 0.9151 0.8954 08890 0.8826 0.8638 0.8396 0.8163 07938 0.9238 0.8885 0.8631 0.8548 0.8466 08227 07921 07629 07350 4 5 0.9057 0.8626 08319 0.8219 0.8121 0.7835 07473 07130 0.6806 6 0.8880 0.8375 0.8018 07903 0.7790 07462 0.7050 0.6663 06302 7 0.8706 0.8131 0.7728 0.7599 0.7473-07107 0.6651 0.6227 0.5835 8 0.8535 0.7894 0.7449 0.7307 07168 06768 0.6274 0.5820 0.5403 9 0.8368 0.7664 0.7180 07026 0.6876 06446 0.5919 0.5439 0.5002 10 0.8203 07441 0.6920 06756 0.6595 0.6139 05584 0.5083 0.4632 20 0.6730 0.5537 0.4789 04564 0.4350 0.3769 0.3118 02584 0.2145 9% Periods 10% 11% 12% 13% 14% 15% 25% 20% 1 0.9174 0.9091 0.9009 0.8929 0.8850 0.8772 0.8696 0.8333 08000 2 0.8417 0.8264 0.8116 0.7972 0.7831 0.7695 0.7561 0.6944 06400 3 0.7722 0.7513 0.7312 0.7118 0.6931 0.6750 06575 0.5787 0.5120 4 0.7084 0683006587 0.6355 0.6133 05921 0.5718 0 4823 0.4096 5 0.6499 0.6209 0.5935 0.5674 0.5428 0.5194 0.4972 0.40190 3277 6 0.5963 0.5645 0.5346 0.5066 0.4803 0.4556 0.4323 0 3349 0.2621 7 0.5470 0.5132 0.4817 0.4523 0.4251 0.3996 0 3759 0.2791 0.2097 8 0.5019 0.4665 0.4339 0.4039 03762 0.3506 0.3269 0.2326 0.1678 9 0.4604 0.4241 0.3909 0.3606 03329 0.3075 0.2843 0.1938 01342 10 04224 03855 0.3522 0.3220 0.2946 0.2697 02472 01615 01074 20 0.1784 0.1485 01240 0.1037 00868 00728 00611 0.0261 00115 TABLE 11.3A Future Value of an Annuity of $1 8% Periods 6% 2% 7% 3% 4% 3.75% 4.25% 5% 1 1.0000 10000 10000 10000 10000 10000 1.0000 10000 10000 2 20200 20800 20300 2.0700 20375 20400 20425 20500 20600 3 30604 3.0909 3.1139 3.1216 31293 32149 32464 31525 31836 4 41216 4.1836 4.2623 4.4399 4.5061 4.2307 42465 43101 4.3746 5 5.2040 5.3091 5.4163 5.7507 5.3893 5.4434 5.8666 5,5256 5.6371 6 6.3061 6.4684 6.5914 6.6330 73359 6.6748 71533 6.8019 6.9753 7 74343 7.6625 7.8386 78983 79585 8.9228 8.1420 83938 8.6540 8 8.5830 8.8923 91326 10.6366 9.2142 9.2967 9.5491 9.8975 10.2598 9 9.7546 10.1591 12.4876 11.0266 10.4750 10.5828 10.6918 11.4913 11.9780 10 10.9497 11.4639 11.8678 12.0061 12 1462 12.5779 13.1808 13.8164 14.4866 20 24 2974 26.8704 29.0174 29.7781 30.5625 33,0660 36.7856 40.9955 45.7620 Periods 9% 11% 10% 12% 13% 14% 15% 20% 25% 1 1.0000 10000 1.0000 1.0000 10000 1.0000 10000 10000 10000 2 20900 2.1000 2.1100 2.1200 2.1300 2.1400 21500 2.2000 2.2500 3 32781 3.3100 3.3421 3.3744 3.4069 3.4396 3.4725 3.6400 3.8125 4 45731 4.6410 47097 4.7793 4.8498 4.9211 4.9934 5.3680 5.7656 5 5.9847 6.1051 62278 6 3528 6.4803 6 6101 67424 74416 8.2070 6 7.5233 77156 79129 8.1152 8.3227 8.5355 8.7537 9.9299 11.2588 7 9.2004 9.4872 9.7833 10.0890 10.4047 10.7305 110668 12.9159 15.0735 8 11.0285 11.4359 11.8594 12 2997 127573 13.2328 137266 16.4991 19.8419 9 13.0210 13.5975 14.1640 147757 15.4157 16.0853 16.7856 20.7989 25.8023 10 15.1929 15.9374 16.7220 175487 18.4197 19 3373 20.3037 25.9587 33 2529 20 51601 572750 64.2028 72.0524 80.9468 91.0249 102.4436 186.6880 342 9447 "There is one payment cach porod TABLE 11.4A Present Value of Annuity of $1 2% Periods 3% 4% 7% 3.75% 4.25% 8% 5% 6% 1 0.9804 0.970909639 0.9615 0.9592 0.9524 0.9434 0.9346 0.9259 1.9416 N 1.9135 1.8929 18861 18794 17833 18594 1.8334 18080 3 25771 2.8839 28286 27883 27751 27620 27232 26730 26243 4 3.8077 37171 3.6514 3.6299 36086 3.5460 3.4651 3.3872 3.3121 un 4.7135 4.5797 4.4833 4.4518 4.4207 43295 4.2124 4.1002 3.9927 6 5.6014 5.4172 5.2851 52421 5.1997 5.0757 4.917347665 4.6229 7 6.4720 6.2303 6.05796.0021 5 9470 57864 5.5824 5.3893 5.2064 8 73255 70197 6.8028 67327 66638 6.4632 6.2098 5.9713 5.7466 9 8.1622 77861 75208 74353 73513 71078 6.8017 6.5152 62469 10 8.9826 8.5302 8.2128 8.1109 8.0109 77217 73601 70236 6.7101 20 16.3514 14.8775 13.8962 13 5903 13 2944 12.4622 11.4699 10.5940 9.8181 Periods 9% 10% 11% 12% 13% 14% 15% 20% 25% 1 0.9174 0.9091 0.9009 0.8929 0.8550 08772 0.8696 0.8333 0.8000 2 17591 17355 17125 16901 16681 16467 1.6257 1.5278 1.4400 3 2.5313 24869 24437 24018 23612 23216 22832 2.1065 1.9520 4 32397 3.1699 3.1024 30373 29745 2.9137 2.8550 2.5887 2.3616 5 3.8897 37908 36959 3.6048 35172 3.4331 33522 2.9906 26893 6 4.4859 43553 4.2305 4.1114 3.9975 3.8887 3.7845 33255 2.9514 7 50330 4.8684 4.7122 4.5638 4.4226 42883 4.1604 3.6046 3.1611 00 5.5348 53349 5.1461 4.9676 4.7988 46389 4.4873 3.8372 3.3289 9 5.9952 5.7590 5.5370 53282 51317 49464 47716 4.0310 3.4631 10 6.4177 61446 5.8892 5.6502 5.4262 5.2161 50188 4.1925 3.5705 20 9.1285 8.5136 7.9633 7.4694 70248 66231 6.2593 4.8696 3.9539 The one payment och period