Answered step by step
Verified Expert Solution
Question
1 Approved Answer
4. Food processors are considering the use of a CuSum chart for monitoring the moisture levels taken from an apple dehydration unit which is

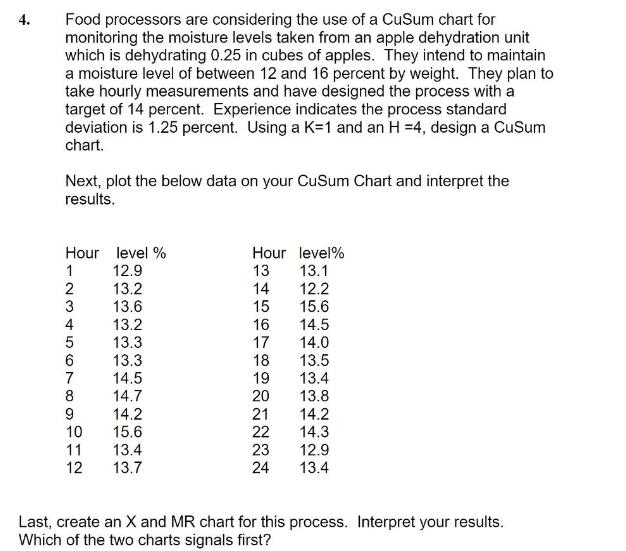
4. Food processors are considering the use of a CuSum chart for monitoring the moisture levels taken from an apple dehydration unit which is dehydrating 0.25 in cubes of apples. They intend to maintain a moisture level of between 12 and 16 percent by weight. They plan to take hourly measurements and have designed the process with a target of 14 percent. Experience indicates the process standard deviation is 1.25 percent. Using a K=1 and an H =4, design a CuSum chart. Next, plot the below data on your CuSum Chart and interpret the results. Hour level % 12.9 2 13.2 1234567 4 13.2 7 8 9 10 13.6 11 12 13.3 13.3 14.5 14.7 14.2 15.6 13.4 13.7 Hour level% 13.1 12.2 15.6 14.5 14.0 13.5 13 14 15 16 17 18 19 20 21 222 23 24 13.4 13.8 14.2 14.3 12.9 13.4 Last, create an X and MR chart for this process. Interpret your results. Which of the two charts signals first?
Step by Step Solution
★★★★★
3.36 Rating (159 Votes )
There are 3 Steps involved in it
Step: 1
Ans b Solution 1 1 ...
Get Instant Access to Expert-Tailored Solutions
See step-by-step solutions with expert insights and AI powered tools for academic success
Step: 2

Step: 3

Ace Your Homework with AI
Get the answers you need in no time with our AI-driven, step-by-step assistance
Get Started


