

Answered step by step
Verified Expert Solution
Question
1 Approved Answer
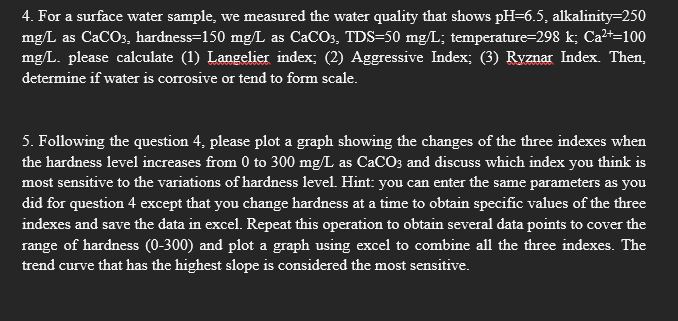
4. For a surface water sample, we measured the water quality that shows pH=6.5, alkalinity=250 mg/L as CaCO3, hardness=150 mg/L as CaCO3, TDS=50 mg/l; temperature=298
Step by Step Solution
There are 3 Steps involved in it
Step: 1

Get Instant Access to Expert-Tailored Solutions
See step-by-step solutions with expert insights and AI powered tools for academic success
Step: 2

Step: 3
Ace Your Homework with AI
Get the answers you need in no time with our AI-driven, step-by-step assistance
Get Started
Sustainable Engineering Principles And Practice
Authors: Bhavik R. Bakshi
1st Edition
1108420451, 9781108420457