Answered step by step
Verified Expert Solution
Link Copied!

Question

1 Approved Answer

4. Hoping to inspire goodwill toward the less fortunate during the holiday season, WalletHub compared the most populated U.S. cities across 21 key metrics to

image text in transcribed
4. Hoping to inspire goodwill toward the less fortunate during the holiday season, WalletHub compared the most populated U.S. cities across 21 key metrics to determine where Americans are most economically disadvantaged. Based on such indicators as the child poverty rate, the food-insecurity rate, and the uninsured rate, they ranked cities in terms of "neediness," where 1 was the neediest (Detroit had that unfortunate distinction). From their list of neediness rankings, the following 13 cities were selected at random and matched to their homicide rates per 100,000 population. WalletHub's Neediness Homicide City Rank rate Baltimore 11 55.4 Charlotte 94 6.9 Cincinnati 32 22.1 Dallas 48 10.4 Houston 60 13.3 Indianapolis 12 17.1 Kansas City 61 23.0 Memphis 3 20.5 Miami 23 17.1 New Orleans 9 41.7 Orlando 88 11.9 Philadelphia 6 17.9 St. Louis 20 59.3 a. Calculate the strength of association between neediness and homicide (Note: be sure to re-rank the cities). b. Using the .05 level of significance, test to see if cities with greater neediness have higher rates of homicide

Step by Step Solution

There are 3 Steps involved in it

Step: 1

blur-text-image

Get Instant Access to Expert-Tailored Solutions

See step-by-step solutions with expert insights and AI powered tools for academic success

Step: 2

blur-text-image

Step: 3

blur-text-image

Ace Your Homework with AI

Get the answers you need in no time with our AI-driven, step-by-step assistance

Get Started

Recommended Textbook for

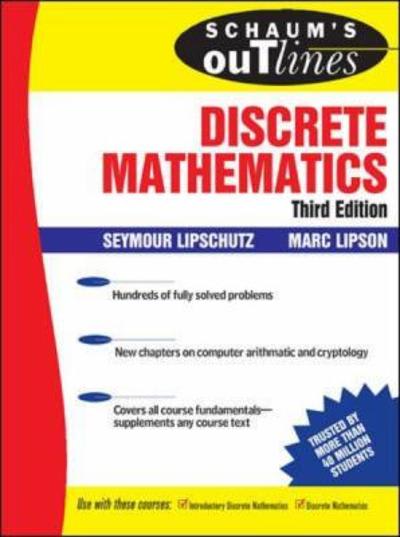
Discrete Mathematics, Revised

Authors: Seymour Lipschutz, Marc Lipson

3rd Edition

0071615873, 9780071615877

More Books

Students also viewed these Mathematics questions

Question

1. Build trust and share information with others.

Answered: 1 week ago