Question
4. Plot the root Locus of the the control system given below G(s)H(s) = k s(s+5) (s+10) Use MATLAB to obtain the root locus

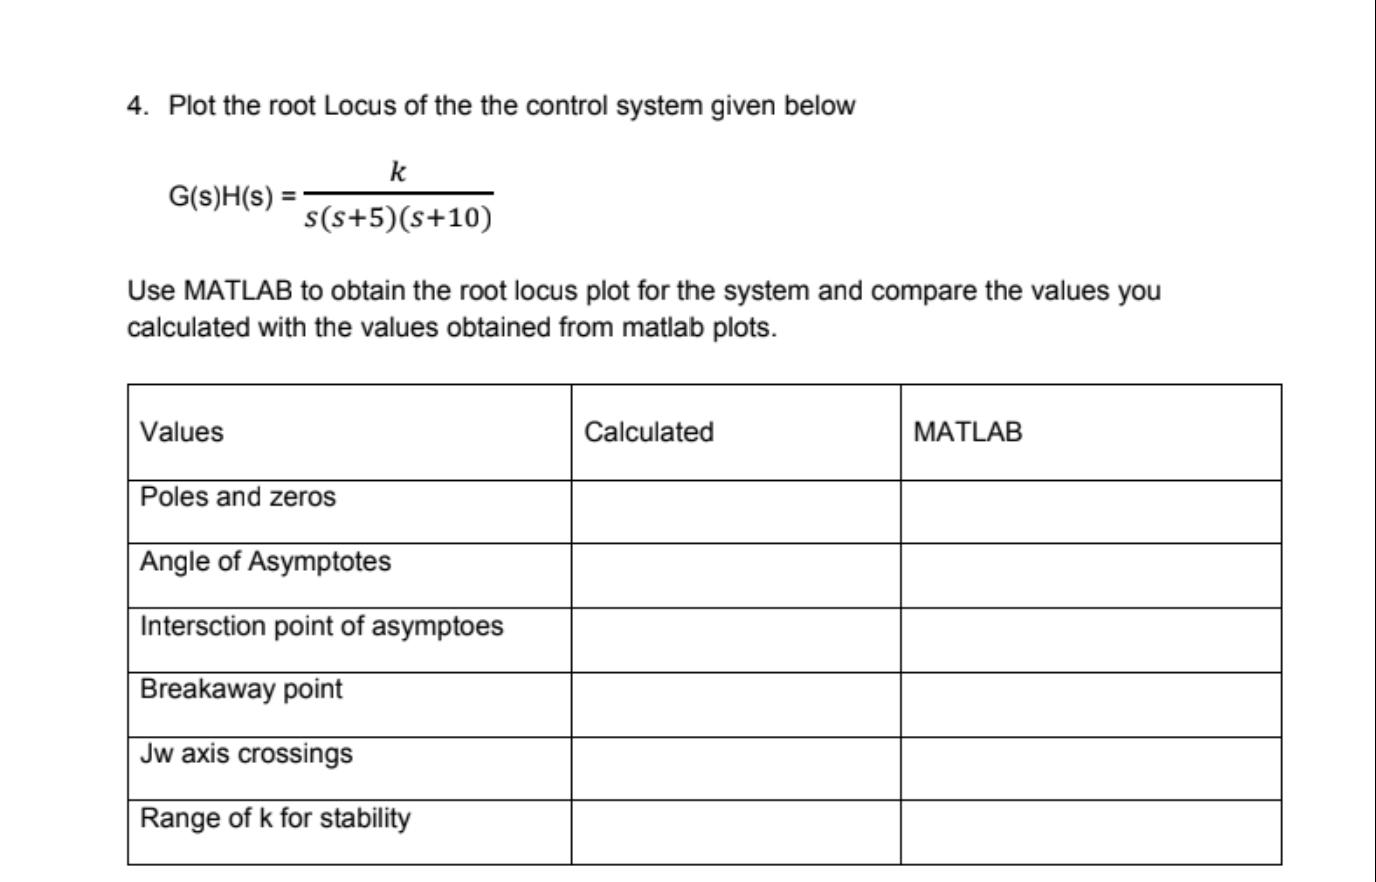
4. Plot the root Locus of the the control system given below G(s)H(s) = k s(s+5) (s+10) Use MATLAB to obtain the root locus plot for the system and compare the values you calculated with the values obtained from matlab plots. Values Poles and zeros Angle of Asymptotes Intersction point of asymptoes Breakaway point Jw axis crossings Range of k for stability Calculated MATLAB
Step by Step Solution
3.40 Rating (153 Votes )
There are 3 Steps involved in it
Step: 1

Get Instant Access to Expert-Tailored Solutions
See step-by-step solutions with expert insights and AI powered tools for academic success
Step: 2

Step: 3

Ace Your Homework with AI
Get the answers you need in no time with our AI-driven, step-by-step assistance
Get StartedRecommended Textbook for
System Dynamics
Authors: William Palm III
3rd edition
73398063, 978-0073398068
Students also viewed these Accounting questions
Question
Answered: 1 week ago
Question
Answered: 1 week ago
Question
Answered: 1 week ago
Question
Answered: 1 week ago
Question
Answered: 1 week ago
Question
Answered: 1 week ago
Question
Answered: 1 week ago
Question
Answered: 1 week ago
Question
Answered: 1 week ago
Question
Answered: 1 week ago
Question
Answered: 1 week ago
Question
Answered: 1 week ago
Question
Answered: 1 week ago
Question
Answered: 1 week ago
Question
Answered: 1 week ago
Question
Answered: 1 week ago
Question
Answered: 1 week ago
Question
Answered: 1 week ago
Question
Answered: 1 week ago
Question
Answered: 1 week ago
Question
Answered: 1 week ago
Question
Answered: 1 week ago
View Answer in SolutionInn App


