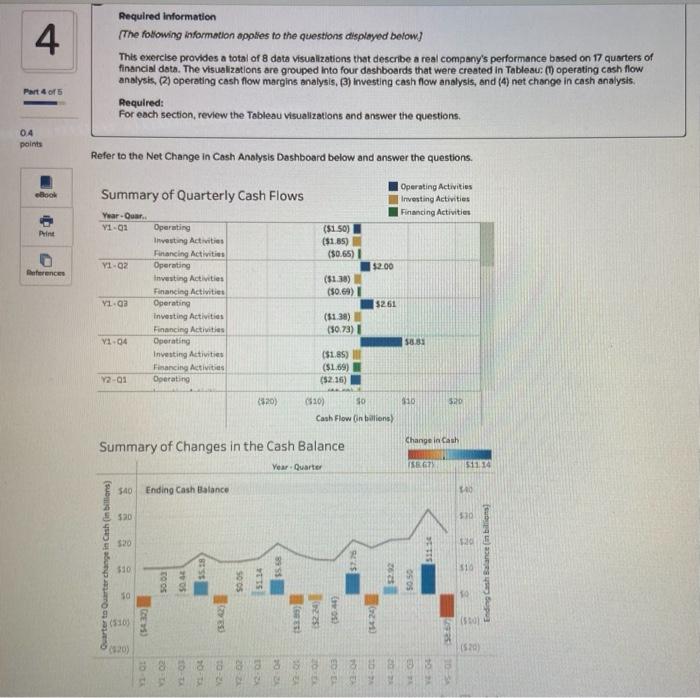
4 Required information The following information applies to the questions displayed below.) This exercise provides a total of 8 data Visualizations that describe a real company's performance based on 17 quarters of financial data. The visualizations are grouped into four dashboards that were created in Tableau: (1) operating cash flow analysis, (2) operating cash flow margins analysis. (3) Investing cash flow analysis, and (4) not change in cash analysis. Required: For each section, review the Tableau visualizations and answer the questions Part 4 of 5 04 points Refer to the Net Change in Cash Analysis Dashboard below and answer the questions. book Summary of Quarterly Cash Flows Operating Activities Investing Activities Financing Activities Year-Our Y1-01 Print ($1.50) ($1.85) (80.65) v1.02 $2.00 herferences (51.38) ($0.69) Y1.2 Operating Investing Activities Financing Activities Operating Investing Activities Financing Activities Operating Investing Activities Financing Activities Operating Investing Activities Financing Activities Operating $261 (51.38) (50.73) V1.04 $8.33 ($1.85) ($1.69) (52.16) Y2-03 (120) 110 520 (10) so Cash Flow Online) Change in Cash Summary of Changes in the Cash Balance Year Quarter SET 51114 540 Ending Cash Balance 520 Quarter to Quartier change in Cash (in billions) 510 5518 51 Ending Cash Balance billions 50:05 0505 30 1568 (130) coros 7005 CE) (1424 (50 5 (120) (570 8 8 8 8 8 8 3 3 3 3 3 3 3 Required Information 4a. Which of the following statements are true with respect to Visualization : Summary of Quarterly Cash Flows? (You may select more than one answer. Single click the box with the question mark to produce a check mark for a correct answer and double click the box with the question mark to empty the box for a wrong answer. Any boxes left with a question mark will be automatically graded as incorrect.) It summarizes the operating investing, and financing cash flows on a quarterly basis beginning with the first quarter of year 1 and trending downward toward the first quarter of year 5 It summarizes the operating, investing, and financing cash flows on a quarterly basis beginning with the first quarter of years 1-5 and trending downward toward the fourth quarter of years 1-4. It depicts financing cash flows in blue and Investing cash flows in green 4b. Which of the following statements are true with respect to Visualization 2: Summary of Changes in the Cash Balance? (You may select more than one answer. Single click the box with the question mark to produce a check mark for a correct answer and double click the box with the question mark to empty the box for a wrong answer. Any boxes left with a question mark will be automatically graded as incorrect.) The trend line included in the visualization tracks the ending cash balance on a year-over-year basis from the first quarter of years 1-5 through the fourth quarter of years 1-4 The trend line included in the visualization tracks the ending cash balance from the first quarter of year 1 through the first quarter of year 5. The trend line depicts the ending cash balance whereas the bars depict the change in the cash balance from one quarter to the next. 4c. Which of the following statements are true with respect to Visualization 1. Summary of Quarterly Cash Flows? (You may select more than one answer. Single click the box with the question mark to produce a check mark for a correct answer and double click the box with the question mark to empty the box for a wrong answer. Any boxes left with a question mark will be automatically graded as incorrect.) The company has only one quarter out of 17 quarters where it had net cash provided by financing activities, rather than net cash used in financing activities. The company has only one quarter out of 17 quarters where it had net cash used in financing activities, rather than net cash provided by financing activities. 2 The company does not have net cash provided by investing activities in any of the 17 quarters 4d. Which of the following statements are true with respect to Visualization 2: Summary of Changes in the Cash Balance? (You may select more than one answer. Single click the box with the question mark to produce a check mark for a correct answer and double click the box with the question mark to empty the box for a wrong answer. Any boxes left with a question mark will be automatically graded as incorrect.) The cash balonce has increased from approximately $10 billion at the end of the first quarter of year 1 to approximately $23 billion by the end of the first quarter of year 5, The cash balance always declines in the first quarter of every year and spikes upward in the fourth quarter of every year. The largest drop in the cash balance occurred during the first quarter of year 5. 4. Which of the following statements are true when comparing Visualizations 1 and 2? (You may select more than one answer. Singl click the box with the question mark to produce a check mark for a correct answer and double click the box with the questio mark to empty the box for a wrong answer. Any boxes left with a question mark will be automatically graded as incorrect.) The first visualization focuses on the overall cash balance whereas the second visualization provides insights with respect to the three types of cash flows summarized in a statement of cash flows--operating, Investing, and financing cash flows. The first visualization provides insights with respect to the three types of cash flows summarized in a statement of cash flows-operating, investing, and financing cash flows-whereas the second visualization focuses on the overall cash balance Both visualizations track cash flow dota beginning with the first quarter of year 1 and concluding with the first quarter of year 5