

Answered step by step
Verified Expert Solution
Question
1 Approved Answer
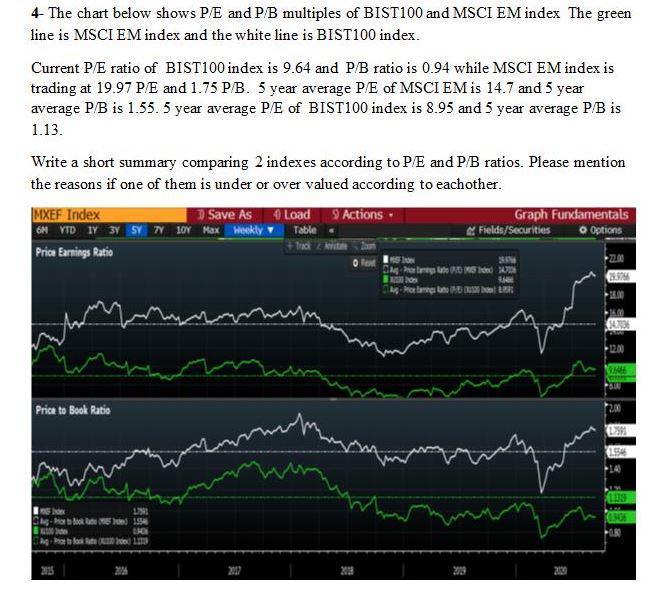
4- The chart below shows P/E and P/B multiples of BIST100 and MSCI EM index The green line is MSCI EM index and the white
Step by Step Solution
There are 3 Steps involved in it
Step: 1

Get Instant Access to Expert-Tailored Solutions
See step-by-step solutions with expert insights and AI powered tools for academic success
Step: 2

Step: 3
Ace Your Homework with AI
Get the answers you need in no time with our AI-driven, step-by-step assistance
Get Started
Grow The Pie How Great Companies Deliver Both Purpose And Profit
Authors: Alex Edmans
1st Edition
1108494854,1108849482