Question
4. The following chart is for the US economy showing fluctuations in investment in new technologies, particularly in information and communications technology. The Nasdaq Index
4. The following chart is for the US economy showing fluctuations in investment in new technologies, particularly in information and communications technology. The Nasdaq Index includes the shares of companies from industries such as computer hardware and software, telecommunications and biotechnology.n?
a) Why does investment in new technology by one firm create incentives for other firms to invest? Explain by discussing the rapid uptake in new information and communication technologies.
b) Why is the stock price more volatile than the level of firms investment?
c) Why is investment more volatile than consumption?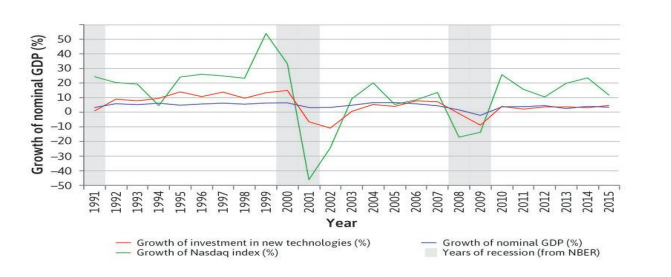
Step by Step Solution
There are 3 Steps involved in it
Step: 1

Get Instant Access to Expert-Tailored Solutions
See step-by-step solutions with expert insights and AI powered tools for academic success
Step: 2

Step: 3
Ace Your Homework with AI
Get the answers you need in no time with our AI-driven, step-by-step assistance
Get Started