Answered step by step
Verified Expert Solution
Question
1 Approved Answer
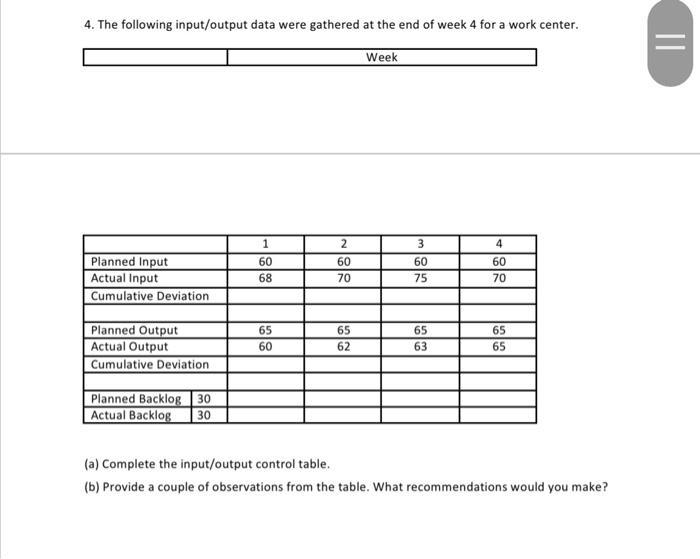
4. The following input/output data were gathered at the end of week 4 for a work center. Week = 1 2 3 4 Planned

4. The following input/output data were gathered at the end of week 4 for a work center. Week = 1 2 3 4 Planned Input 60 60 60 60 Actual Input 68 70 75 70 Cumulative Deviation Planned Output 65 65 65 65 Actual Output 60 62 63 65 Cumulative Deviation Planned Backlog 30 Actual Backlog 30 (a) Complete the input/output control table. (b) Provide a couple of observations from the table. What recommendations would you make?
Step by Step Solution
There are 3 Steps involved in it
Step: 1

Get Instant Access to Expert-Tailored Solutions
See step-by-step solutions with expert insights and AI powered tools for academic success
Step: 2

Step: 3

Ace Your Homework with AI
Get the answers you need in no time with our AI-driven, step-by-step assistance
Get Started


