

Answered step by step
Verified Expert Solution
Question
1 Approved Answer
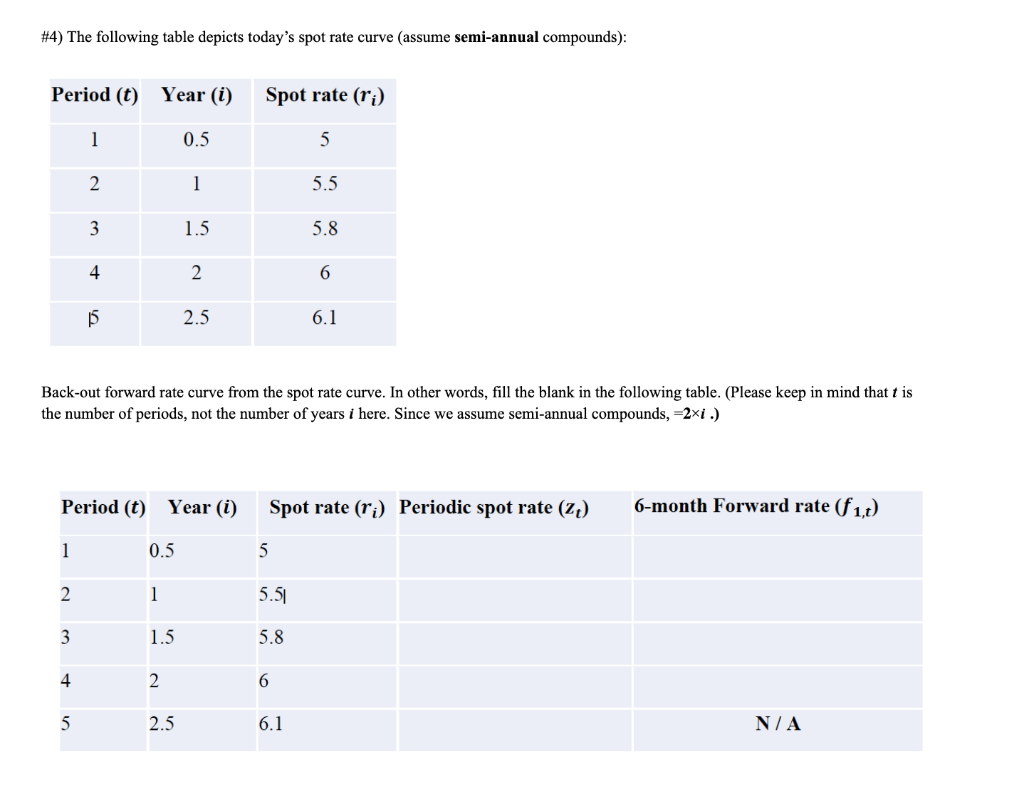
#4) The following table depicts today's spot rate curve (assume semi-annual compounds): Back-out forward rate curve from the spot rate curve. In other words, fill
Step by Step Solution
There are 3 Steps involved in it
Step: 1

Get Instant Access to Expert-Tailored Solutions
See step-by-step solutions with expert insights and AI powered tools for academic success
Step: 2

Step: 3
Ace Your Homework with AI
Get the answers you need in no time with our AI-driven, step-by-step assistance
Get Started
Global Finance And Development
Authors: David Hudson
1st Edition
0415436354, 978-0415436359