Question
3. The following table shows frequencies of highest educational attainment by region. No HS degree HS degree Some only college North South 9 11

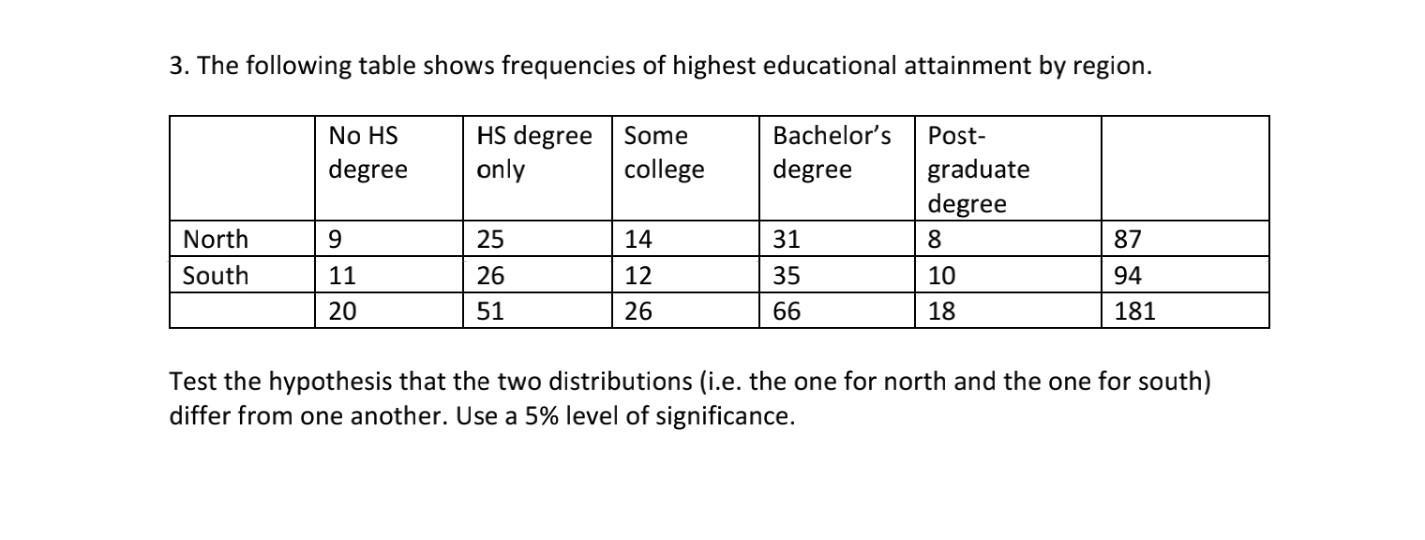
3. The following table shows frequencies of highest educational attainment by region. No HS degree HS degree Some only college North South 9 11 20 25 26 51 14 12 26 Bachelor's Post- degree 31 35 66 graduate degree 8 10 18 87 94 181 Test the hypothesis that the two distributions (i.e. the one for north and the one for south) differ from one another. Use a 5% level of significance.
Step by Step Solution
There are 3 Steps involved in it
Step: 1
Solution Alternatively if you are interested in some general statistics about the highest educationa...
Get Instant Access to Expert-Tailored Solutions
See step-by-step solutions with expert insights and AI powered tools for academic success
Step: 2

Step: 3

Ace Your Homework with AI
Get the answers you need in no time with our AI-driven, step-by-step assistance
Get StartedRecommended Textbook for
Stats Data And Models
Authors: Richard D. De Veaux, Paul D. Velleman, David E. Bock
4th Edition
321986490, 978-0321989970, 032198997X, 978-0321986498
Students also viewed these Accounting questions
Question
Answered: 1 week ago
Question
Answered: 1 week ago
Question
Answered: 1 week ago
Question
Answered: 1 week ago
Question
Answered: 1 week ago
Question
Answered: 1 week ago
Question
Answered: 1 week ago
Question
Answered: 1 week ago
Question
Answered: 1 week ago
Question
Answered: 1 week ago
Question
Answered: 1 week ago
Question
Answered: 1 week ago
Question
Answered: 1 week ago
Question
Answered: 1 week ago
Question
Answered: 1 week ago
Question
Answered: 1 week ago
Question
Answered: 1 week ago
Question
Answered: 1 week ago
Question
Answered: 1 week ago
Question
Answered: 1 week ago
Question
Answered: 1 week ago
Question
Answered: 1 week ago
Question
Answered: 1 week ago
Question
Answered: 1 week ago
View Answer in SolutionInn App


