Answered step by step
Verified Expert Solution
Link Copied!

Question

1 Approved Answer

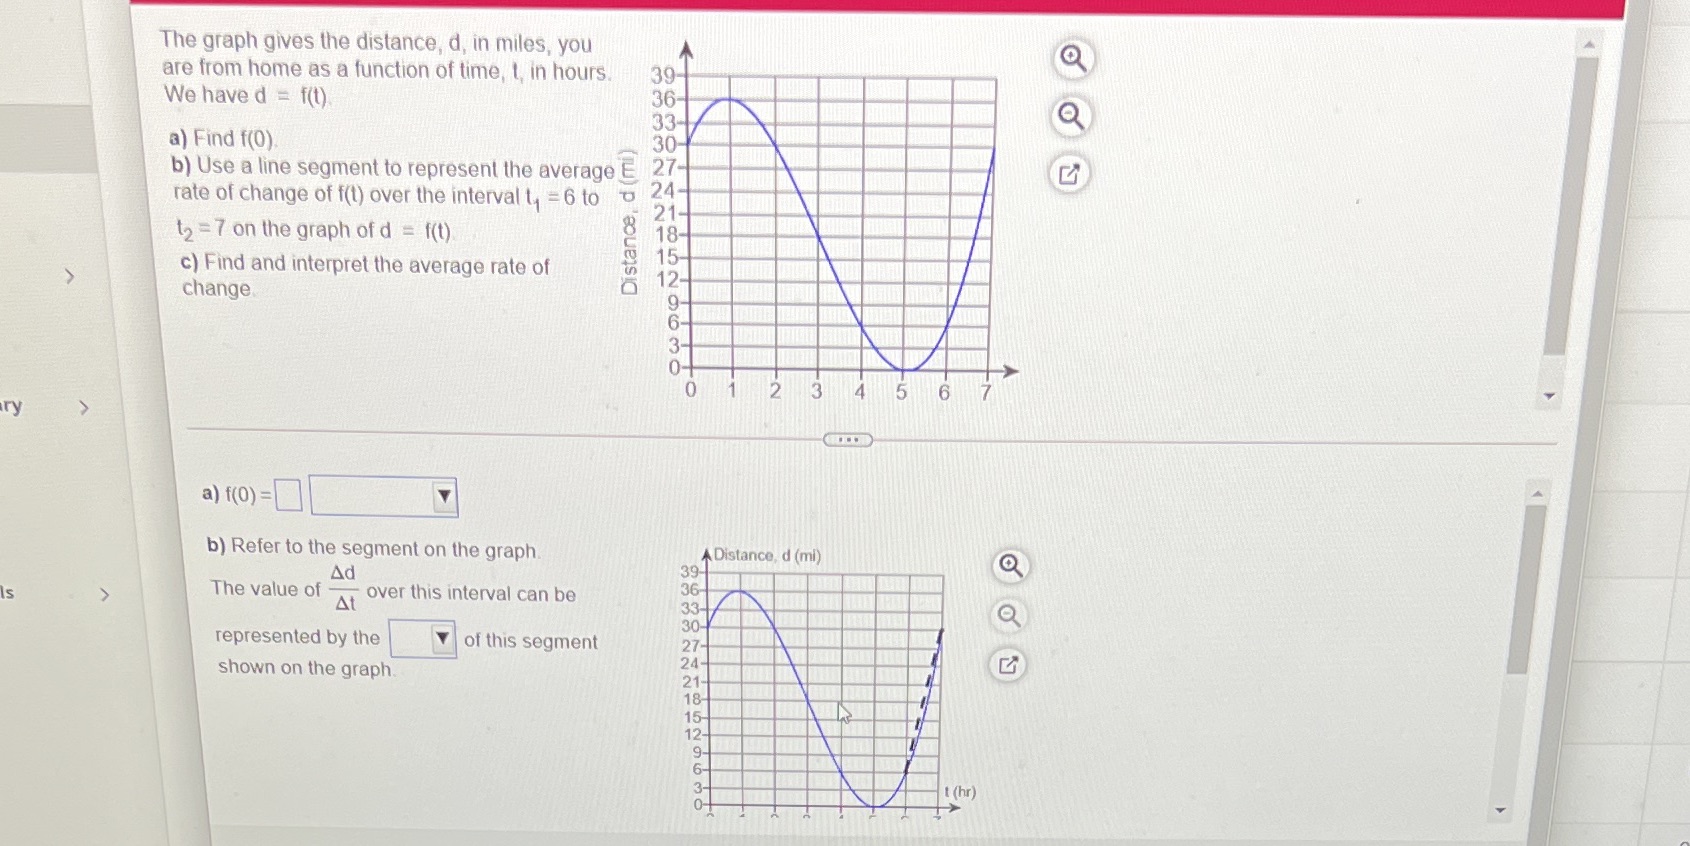
4. The graph gives the distance, d, in miles, you are from home as a function of time, t, in hours. O 39- We have

4.

image text in transcribed
The graph gives the distance, d, in miles, you are from home as a function of time, t, in hours. O 39- We have d = f(t) 36- 33- Q a) Find f(0). 30- b) Use a line segment to represent the average E 27- rate of change of f(1) over the interval t, = 6 to 24- 21- 12 = 7 on the graph of d = f(t) 18- Distance, d c) Find and interpret the average rate of 15- change. 12- 6 ry a) f(0) = b) Refer to the segment on the graph A Distance, d (mi) Ad 39- O The value of - over this interval can be 36- 33- 30- represented by the of this segment 27- shown on the graph. 24. 21- 18- 15- 12- 9- 6- O- 1 (hr)

Step by Step Solution

There are 3 Steps involved in it

Step: 1

blur-text-image

Get Instant Access to Expert-Tailored Solutions

See step-by-step solutions with expert insights and AI powered tools for academic success

Step: 2

blur-text-image

Step: 3

blur-text-image

Ace Your Homework with AI

Get the answers you need in no time with our AI-driven, step-by-step assistance

Get Started

Recommended Textbook for

Algebra (subscription)

Authors: Elayn Martin Gay

6th Edition

0135176301, 9780135176306

More Books

Students also viewed these Mathematics questions