

Answered step by step
Verified Expert Solution
Question
1 Approved Answer
4. The graph of a function g is shown on the xy-plane on the interval (-7,7]. a. A table of selected values is given
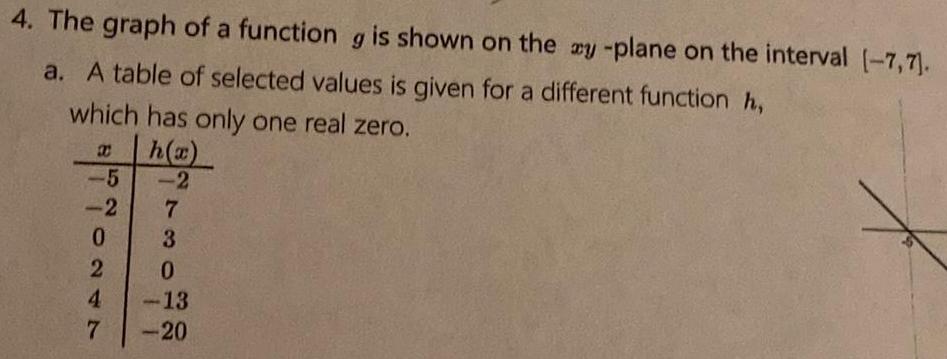
4. The graph of a function g is shown on the xy-plane on the interval (-7,7]. a. A table of selected values is given for a different function h, which has only one real zero. B h(x) -5 -2 -2 7 0 3 2 0 4 -13 7 -20
Step by Step Solution
There are 3 Steps involved in it
Step: 1

Get Instant Access to Expert-Tailored Solutions
See step-by-step solutions with expert insights and AI powered tools for academic success
Step: 2

Step: 3
Ace Your Homework with AI
Get the answers you need in no time with our AI-driven, step-by-step assistance
Get Started
Advanced Engineering Mathematics
Authors: A. Ramakrishna Prasad
1st Edition
8126543876, 978-8126543878