

Question
4. The Laffer curve Governments often place so-called sin taxes on goods or services such as cigarettes, alcohol, and pornography. These kinds of taxes are
4. The Laffer curve
Governments often place so-called sin taxes on goods or services such as cigarettes, alcohol, and pornography. These kinds of taxes are popular with politicians because they are usually more palatable to voters than income taxes.
To understand the effect of such a tax, consider the monthly market for adult DVDs, which is shown on the following graph.
Use the graph input tool to help you answer the following questions. You will not be graded on any changes you make to this graph.
Note: Once you enter a value in a white field, the graph and any corresponding amounts in each grey field will change accordingly.
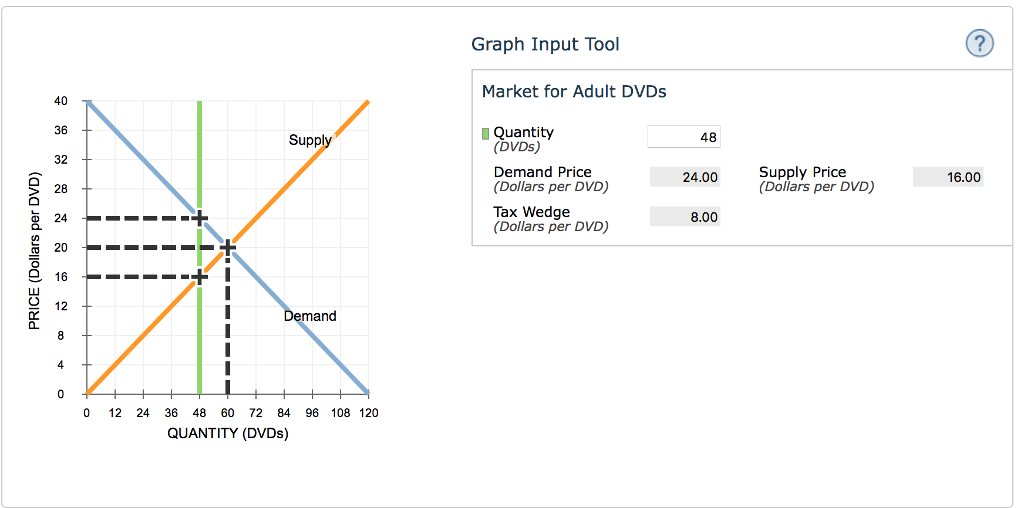
Suppose the government imposes an $8-per-DVD tax on suppliers.
At this tax amount, the equilibrium quantity of adult DVDs is ______DVDs, and the government collects__________in tax revenue.
Now calculate the government's tax revenue if it sets a tax of $0, $8, $16, $20, $24, $32, or $40 per DVD. (Hint: To find the equilibrium quantity after the tax, adjust the Quantity field until the Tax Wedge equals the value of the per-unit tax.) Using the data you generate, plot a Laffer curve by using the green points (triangle symbol) to plot total tax revenue at each of those tax levels.
Note: Plot your points in the order in which you would like them connected. Line segments will connect the points automatically.
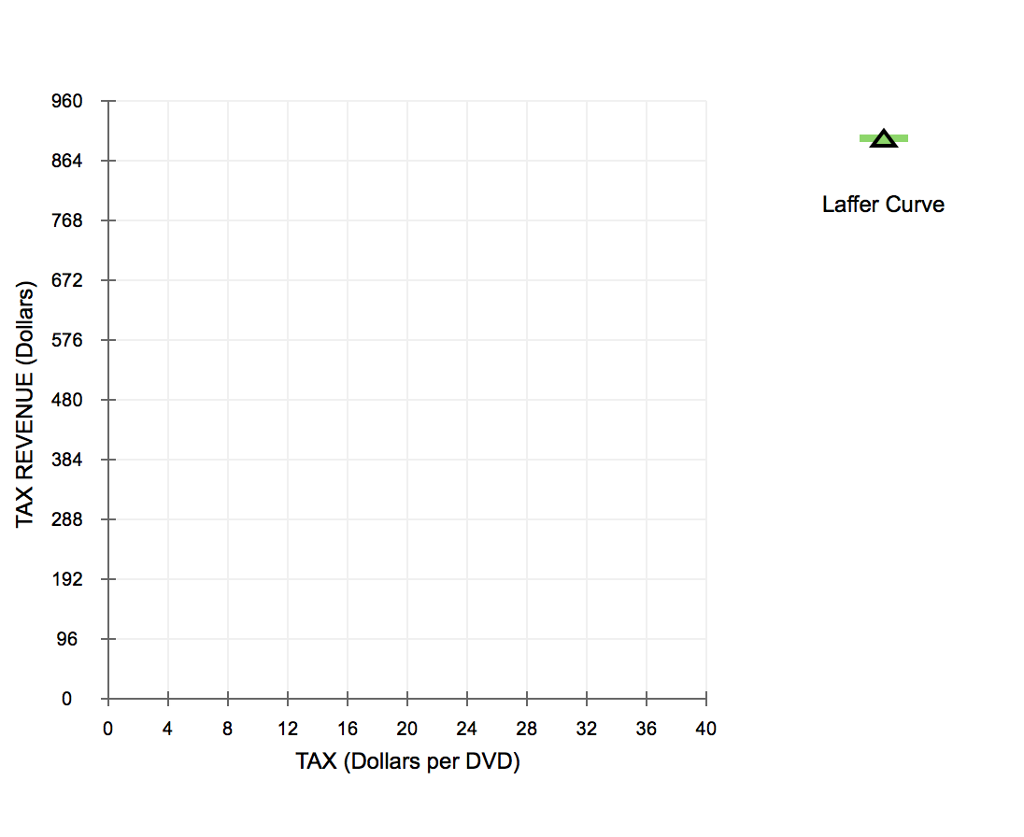
Suppose the government is currently imposing a $24-per-DVD tax on adult DVDs.
True or False: The government can raise its tax revenue by increasing the per-unit tax on adult DVDs.
True
False
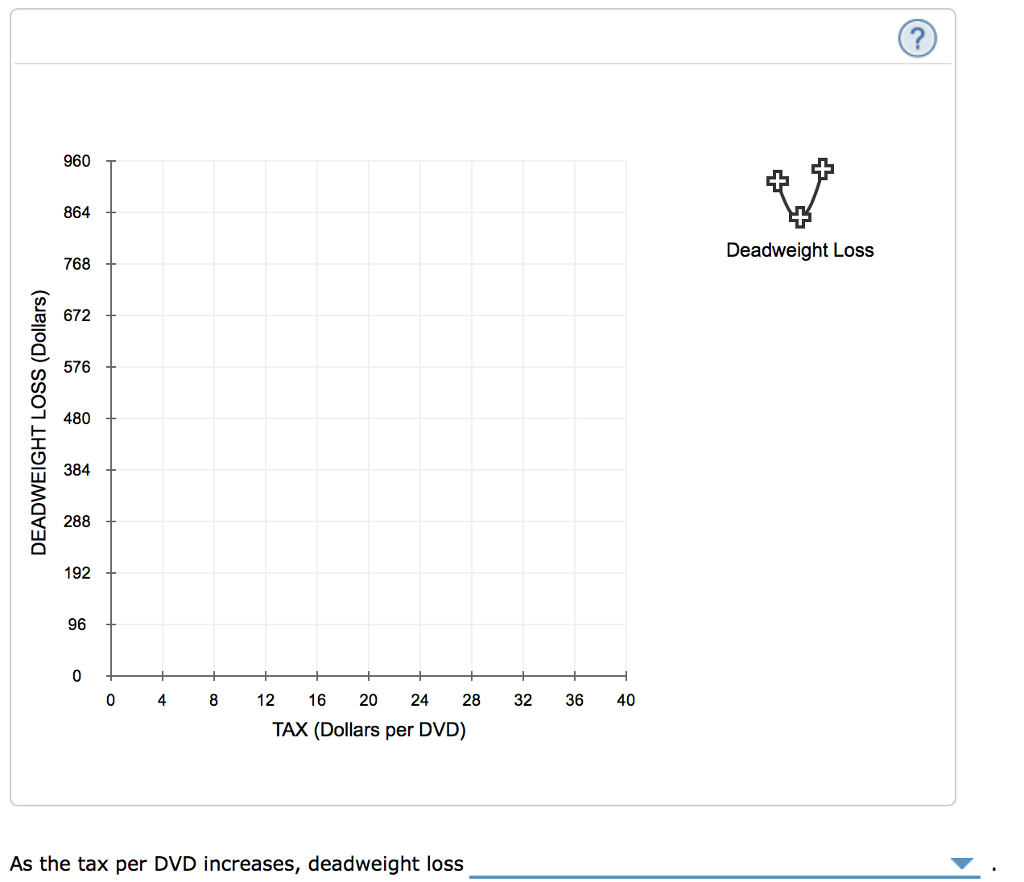
Consider the deadweight loss generated in each of the following cases: no tax, a tax of $16 per DVD, and a tax of $32 per DVD.
On the following graph, use the black curve (plus symbols) to illustrate the deadweight loss in these cases. (Hint: Remember that the area of a triangle is equal to 12BaseHeight12BaseHeight. In the case of a deadweight loss triangle found on the graph input tool, the base is the amount of the tax and the height is the reduction in quantity caused by the tax.)
Graph Input Tool Market for Adult DVDs 40 36 32 28 24 O 20 Supply Quantity 48 (DVDs) Demand Price (Dollars per DVD) Tax Wedge (Dollars per DVD) Supply Price (Dollars per DVD) 24.00 16.00 8.00 O 12 emand 4 0 12 24 36 48 60 72 84 96 108 120 QUANTITY (DVDs)
Step by Step Solution
There are 3 Steps involved in it
Step: 1

Get Instant Access to Expert-Tailored Solutions
See step-by-step solutions with expert insights and AI powered tools for academic success
Step: 2

Step: 3
Ace Your Homework with AI
Get the answers you need in no time with our AI-driven, step-by-step assistance
Get Started
Micro Entrepreneurship And Micro Enterprise Development In Malaysia Emerging Research And Opportunities
Authors: Abdullah Al Mamun , Mohammad Nurul Huda Mazumder, Noor Raihani Zainol, Rajennd Muniady
1st Edition
1522584730,1522584757